The Three Major Trading Sessions
⏱ 7 min readThe forex market never sleeps — it trades 24 hours a day, five days a week. But not all hours are equal. The market is divided into three major trading sessions, each named after the region that dominates trading activity during that window. Understanding these sessions is the first step to understanding the Asia Sweep strategy.
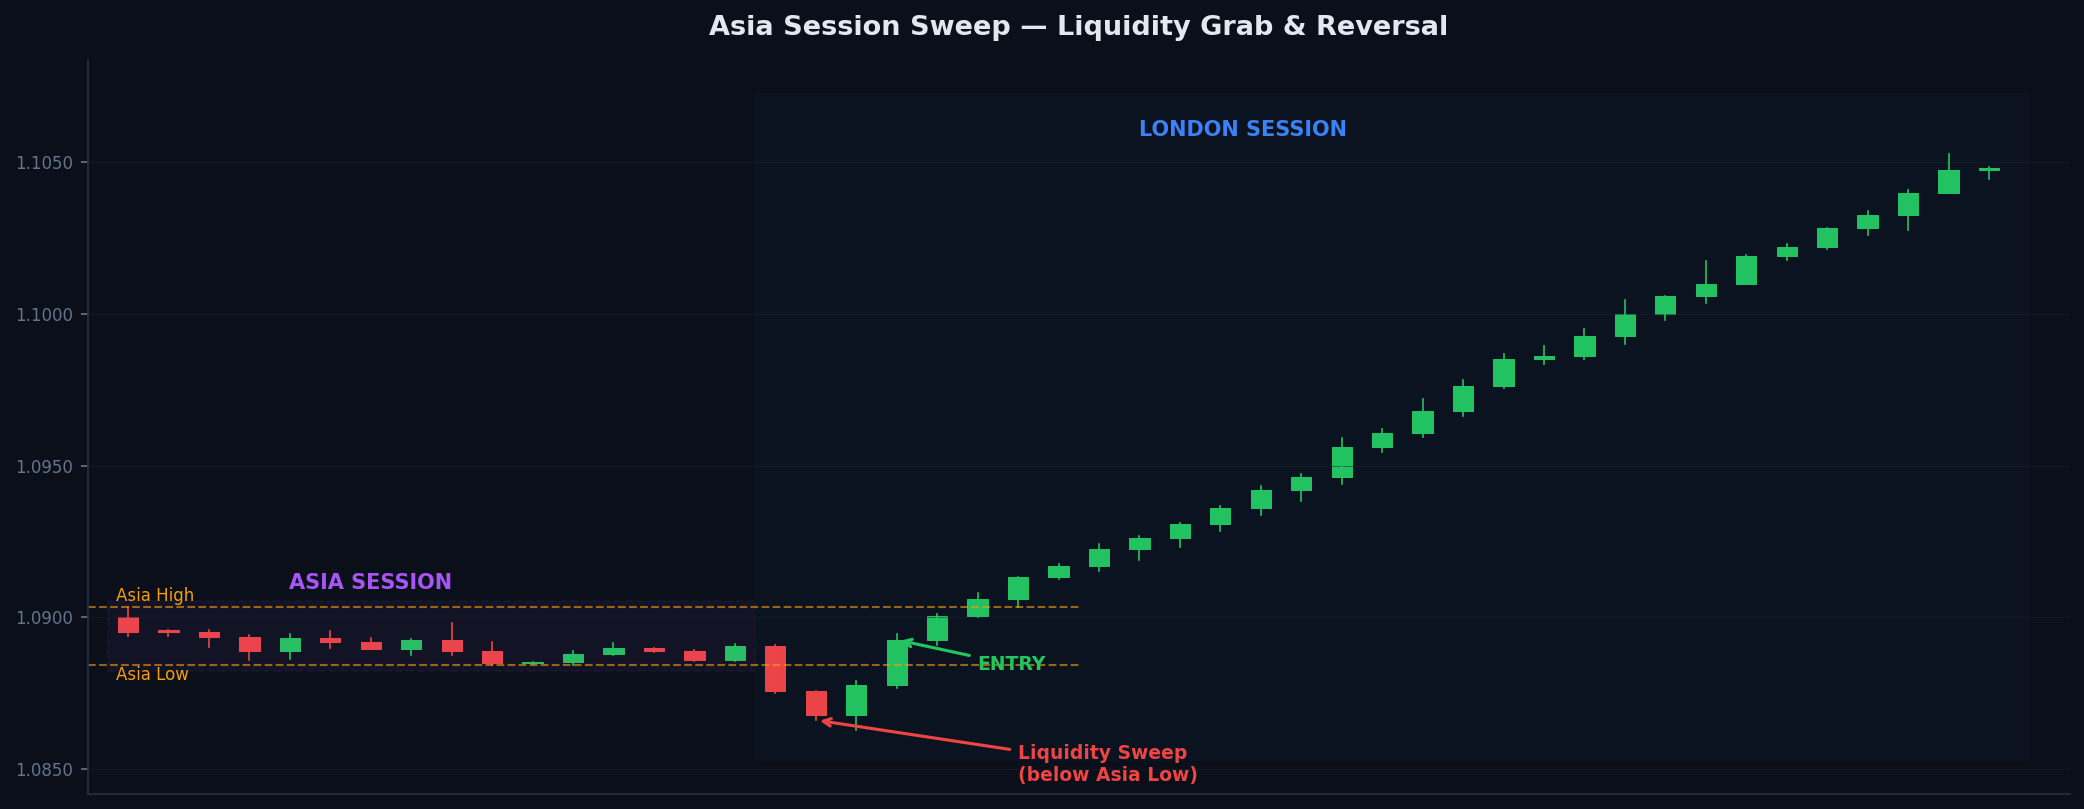
A classic Asia Sweep setup — price consolidates during Asia, sweeps a level at London open, then reverses sharply in the opposite direction
The Three Sessions
Why the Session Order Matters
The sequence of these sessions is not random — it creates a predictable daily rhythm that you can trade. Asia opens first and creates a range. Then London opens with a surge of institutional activity. This transition point — the London open at 08:00 GMT — is the most important moment in the day for Asia Sweep traders.
| Session | GMT Hours | Volatility | Best For |
|---|---|---|---|
| Asia (Tokyo) | 00:00 – 08:00 | Low | Range building, identifying levels |
| London | 08:00 – 17:00 | High | Sweep execution, trend initiation |
| New York | 13:00 – 22:00 | High | Continuation trades, USD setups |
| London/NY Overlap | 13:00 – 17:00 | Very High | Peak volume, major moves |
All session times in this course are quoted in GMT. If you are in the UK during BST (British Summer Time), add one hour. Use a world clock or your charting platform's session indicators to confirm the exact open/close times in your timezone. Never trade the wrong session window because of a timezone error.
There are three major sessions — Asia (00:00–08:00 GMT), London (08:00–17:00 GMT), and New York (13:00–22:00 GMT). Asia is the quietest. London is the most volatile and is where the Asia Sweep setup triggers. Knowing when each session opens is non-negotiable for this strategy.
- Asia session: 00:00–08:00 GMT — low volatility, range building
- London session: 08:00–17:00 GMT — high volatility, where sweeps occur
- New York session: 13:00–22:00 GMT — second-largest session
- London open (08:00 GMT) is the most important time of day for this strategy
- All times quoted in GMT — adjust for your local timezone
Quick Quiz
1. At what GMT time does the London session open?
2. Which session is described as the most volatile, accounting for roughly 35% of daily forex volume?
3. What is the key characteristic of the Asia session that makes the sweep strategy possible?
4. When does the London/New York overlap occur?
Why the Asia Session Matters
⏱ 6 min readAsia might be the quietest session, but dismissing it as unimportant is a critical mistake. Experienced traders pay close attention to Asia precisely because of its quietness — because quiet markets build up pressure, and that pressure has to release somewhere.
Asia Creates a Range
During the Asia session, price tends to consolidate — moving back and forth within a relatively tight range. This range has a clear high (the highest point reached) and a clear low (the lowest point reached). This is not random noise. This range represents a zone where buyers and sellers have been relatively balanced.
Liquidity Builds at the Edges
Here is the critical insight: as price consolidates within the Asia range, traders place orders at predictable locations:
- Above the Asia high — retail traders place buy-stop pending orders here, and short sellers place their stop losses here
- Below the Asia low — retail traders place sell-stop pending orders here, and long buyers place their stop losses here
These clusters of orders represent liquidity pools. Smart money — institutional traders and large banks — knows exactly where these orders sit. They need this liquidity to fill their own large positions.
- Asia Range
- The high and low created during the 00:00–08:00 GMT session. These become the key reference levels for the day.
- Liquidity Pool
- A cluster of pending orders (stops and limits) sitting above or below a key price level. Smart money targets these to fill positions.
- Consolidation
- When price moves sideways within a defined range, neither making significant new highs nor lows. Asia often produces classic consolidation.
- Smart Money
- Large institutional traders — banks, hedge funds, central banks — whose order flow genuinely moves markets. Their footprints are visible on charts.
The London Setup
This is the core mechanic of the entire strategy. When London opens at 08:00 GMT, institutional traders have a specific playbook: they look for the liquidity that built up overnight during Asia, and they use it. In practical terms, this often means price will briefly move beyond the Asia high or low — triggering all those pending orders and stop losses — before reversing sharply in the opposite direction.
Many traders see the Asia range break and immediately jump in the direction of the break. This is exactly the trap. The initial break of the Asia range at London open is often a false break — a sweep designed to grab liquidity before the real move. Wait for the reversal confirmation before entering.
Asia creates a range. That range builds liquidity (stops and pending orders) above the high and below the low. Smart money uses the London open to sweep this liquidity — briefly breaking the Asia range before reversing. Understanding this mechanic is the entire foundation of the Asia Sweep strategy.
Quick Quiz
1. Where do most retail traders place their stop losses when they are in a long (buy) trade?
2. Why does smart money target the Asia range highs and lows at the London open?
3. A beginner trader sees price break above the Asia high at London open and immediately buys. What risk are they taking?
The Asia Range
⏱ 5 min readThe Asia Range is the most fundamental concept in this entire strategy. Before you can trade the sweep, you need to know what you're sweeping. The Asia Range is simply the high and low formed during the Asia session — from 00:00 to 08:00 GMT. These two price levels become your key reference points for the entire trading day.
How to Mark the Asia Range
The process is straightforward, but precision matters. Here is exactly how to do it every morning:
- Open your charting platform before the London session opens (ideally at or before 07:45 GMT)
- Switch to a 15-minute or 1-hour timeframe
- Identify the highest price reached between 00:00 and 08:00 GMT — this is your Asia High
- Identify the lowest price reached between 00:00 and 08:00 GMT — this is your Asia Low
- Draw a horizontal line at both levels and label them clearly
- Note the size of the range (Asia High minus Asia Low in pips) — this affects where your stops and targets will be
Strictly, the Asia Range runs from 00:00 GMT (Tokyo open) to 08:00 GMT (London open). Some traders use 00:00–09:00 GMT to capture the full overlap period. For consistency, stick to 00:00–08:00 GMT until you have experience reading different markets' rhythms.
Why These Levels Are So Significant
The Asia Range highs and lows are significant because they represent the most recent areas of accepted value — the price range where buyers and sellers were in relative equilibrium throughout an 8-hour session. Breaking beyond these levels signals that something has changed — a new force has entered the market. At London open, that new force is institutional volume.
Range Size Matters
Not all Asia Ranges are equal. A narrow range (10–20 pips on EUR/USD) creates tight, high-probability sweeps. A wide range (50+ pips) may be harder to trade cleanly. As a guideline:
| Range Size (EUR/USD) | Quality | Notes |
|---|---|---|
| 10–25 pips | Ideal | Tight consolidation, clear sweep targets, well-defined RR |
| 25–40 pips | Good | Still tradeable but watch for larger stop requirements |
| 40–60 pips | Caution | Wider range may mean larger moves or choppy price action |
| 60+ pips | Skip or reduce size | Too wide; often indicates a high-impact event was in play overnight |
The Asia Range is the high and low formed between 00:00–08:00 GMT. Mark these levels every day before 08:00 GMT using a 15M or 1H chart. They become your key reference levels — the targets that smart money will sweep at London open. A tighter range (10–25 pips on majors) typically produces cleaner setups.
- Set a daily alarm for 07:45 GMT
- Mark Asia High and Asia Low on your chart
- Note the range size in pips
- Check economic calendar for any news between 08:00–10:00 GMT
- If range is too wide (>60 pips on EUR/USD), consider skipping or reducing position size
Quick Quiz
1. When should you mark the Asia Range on your chart?
2. On EUR/USD, an Asia Range of 15 pips is considered...
3. The Asia High and Asia Low are significant because they represent...
Understanding exactly what a liquidity sweep is, how to spot it in real time, and the difference between a bullish and bearish sweep setup.
What is a Liquidity Sweep?
⏱ 7 min readThe liquidity sweep is the central mechanic that makes this entire strategy work. Without understanding sweeps deeply, you will keep misreading the market. With this concept clearly understood, you will start seeing manipulation patterns everywhere — and know how to position yourself on the right side of them.
The Core Definition
A liquidity sweep occurs when price moves beyond a key level — briefly — to trigger the orders sitting there, then reverses sharply in the opposite direction. The move beyond the key level is not a genuine breakout. It is a calculated collection of liquidity.
- Liquidity Sweep
- Price briefly moves beyond a key level (triggering stops and pending orders there), then reverses. The "sweep" collects the orders sitting at that level.
- Stop Hunt
- Another name for a liquidity sweep. The move is specifically targeting the stop-loss orders placed by retail traders at obvious levels.
- False Break
- When price appears to break a key level but then closes back inside it. The candlestick wick through the level is the visual signature of a sweep.
- Rejection Candle
- A candlestick that moves through a level but closes strongly away from it, leaving a long wick. This is your entry signal after a sweep.
Why Does This Happen?
Large institutional traders — banks and hedge funds — cannot simply place a buy order for £100 million at the current market price without moving the market significantly against themselves. They need sellers on the other side of their trade. Where do they find sellers? At the exact levels where retail traders have their stops and pending orders.
By pushing price briefly below a key support level, institutions trigger:
- The stop losses of traders who are long (they get stopped out, creating sell orders)
- The pending sell orders of breakout traders who were waiting for the level to break
All of those sell orders flood the market. The institution absorbs them — they buy against them. Once they have filled their position, there are no more sellers, price has no reason to continue down, and it reverses sharply upward. The retail traders just had their stops hunted. The institution has its position. The real move begins.
The Visual Signature
On a chart, a liquidity sweep leaves a very specific visual pattern:
- A wick (or spike) that extends beyond the key level
- The candle body closes back inside the range — confirming the rejection
- Often followed by a strong, fast move in the opposite direction
The wick is your evidence. The longer and sharper the wick, with a strong close back inside the range, the more convincing the sweep signal is.
A genuine breakout closes beyond the level, with multiple candles confirming the move, and does not immediately reverse. A sweep shows a wick beyond the level but the candle (or a subsequent candle) closes back inside the range. The candle close is the key — body inside the range = likely sweep.
A liquidity sweep is when price briefly moves beyond a key level to collect stop losses and pending orders, then reverses. It happens because institutions need liquidity to fill large positions. On a chart, it appears as a wick through a level with the candle body closing back inside. The wick is your signal. The reversal is your trade.
Quick Quiz
1. What is the primary purpose of a liquidity sweep from an institutional perspective?
2. On a candlestick chart, what is the visual signature of a liquidity sweep?
3. After a sweep below the Asia low, what do you expect price to do next?
Identifying the Asia Sweep
⏱ 8 min readUnderstanding the theory is one thing — identifying the setup in real time is another. This lesson gives you the exact sequence of events to look for. The Asia Sweep is a four-step pattern that repeats consistently on major forex pairs at the London open.
The Four-Step Sequence
- Asia builds the range (00:00–07:59 GMT): Price consolidates. A clear high and low form. You have marked these levels on your chart before 08:00 GMT.
- London opens (08:00 GMT): Volume increases sharply. Price begins to move. Watch it with your full attention from 08:00–10:00 GMT.
- Price sweeps beyond the Asia high or low: A sharp, fast move takes price briefly through one of your marked levels. Look for a wick — the candle body should begin to close back. This should happen within the first 1–2 hours of London open.
- Rejection/reversal candle forms: Price closes back inside the Asia range (or at minimum, below the sweep high / above the sweep low). A clear rejection candle is your entry signal.
The best Asia Sweeps occur within the first two hours of the London open — between 08:00 and 10:00 GMT. Sweeps that occur later in the London session (after 11:00 GMT) are less reliable and should be treated with additional scepticism. The earlier the sweep, the cleaner it tends to be.
What to Watch for on the Chart
When you are sitting at your screen at 08:00 GMT, here is what you are monitoring:
- Is price pushing toward the Asia high or the Asia low?
- If it breaks through — does the candle close back inside the range?
- Is the sweep wick sharp and decisive, or slow and grinding?
- After the wick, does price begin moving away quickly in the opposite direction?
Example: EUR/USD — Bullish Asia Sweep
The Importance of the Rejection Candle
The rejection candle is your confirmation signal. Do not enter on the wick alone — wait for the candle to close. The close tells you that price has genuinely rejected the level and is not simply slow. A confirmed close back inside the range dramatically increases the probability of the reversal following through.
The most common mistake is entering too early — jumping in on the wick before the candle closes. If the sweep continues and price keeps falling through your Asia low, you are now in a losing trade with no confirmation. Wait for the candle close. Missing the first 10 pips of a move is far cheaper than entering a false signal and taking a full stop loss.
The Asia Sweep follows a four-step pattern: Asia range forms → London opens → price sweeps the Asia high or low → rejection/reversal candle confirms. The ideal window is 08:00–10:00 GMT. Always wait for candle close confirmation before entering. The rejection candle is your entry signal, not the wick itself.
Quick Quiz
1. Within what time window do the most reliable Asia Sweeps typically occur?
2. Why should you wait for a candle close before entering a trade after a sweep?
3. In the EUR/USD example in this lesson, what was the Asia Range size?
Bullish vs Bearish Asia Sweep
⏱ 6 min readThe Asia Sweep can set up in two directions — and the direction of the sweep tells you exactly which way the real move will go. This is one of the most elegant aspects of the strategy: the manipulation itself signals the intended direction.
The Two Sweep Directions
↑ Bullish Asia Sweep
- Price sweeps below the Asia Low
- Wick extends below the Asia Low
- Candle closes back above the Asia Low
- Price then reverses and moves upward
- Target: Asia High (and beyond)
↓ Bearish Asia Sweep
- Price sweeps above the Asia High
- Wick extends above the Asia High
- Candle closes back below the Asia High
- Price then reverses and moves downward
- Target: Asia Low (and beyond)
The logic is the same in both cases — liquidity is collected, then the real directional move begins. The sweep direction simply tells you which side of the market was being targeted.
Why the Sweep Direction Matters
The direction of the sweep reveals institutional intent. A bullish sweep (below the Asia Low) tells you that institutions needed to buy — they drove price down to collect sell-side liquidity (stops from longs, sell limits from bears) before pushing price higher. They now have their long position filled and price will move up.
A bearish sweep (above the Asia High) tells you the opposite — institutions needed to sell, they drove price up to collect buy-side liquidity (stops from shorts, buy limits from bulls), and will now push price lower.
Which Direction is More Common?
On a given day, you cannot predict in advance whether the sweep will be bullish or bearish. Your job is simply to wait and observe which side gets swept first — and then trade the reversal from that direction. Do not predict. React to what you see.
Occasionally, price will sweep the Asia Low and then sweep the Asia High (or vice versa) — this is called a "double sweep" or "range expansion." In these situations, the second sweep is often the true signal. If you see both sides swept within the first two hours, wait for the second sweep's rejection before trading. Double sweeps are messier but can offer excellent RR when identified correctly.
| Bullish Sweep | Bearish Sweep | |
|---|---|---|
| Sweep level | Below Asia Low | Above Asia High |
| Liquidity collected | Sell-side (long stops, sell limits) | Buy-side (short stops, buy limits) |
| Trade direction | Buy (Long) | Sell (Short) |
| Initial target | Asia High | Asia Low |
| Extended target | Beyond Asia High | Beyond Asia Low |
Bullish sweep: price sweeps below the Asia Low then reverses up — you buy. Bearish sweep: price sweeps above the Asia High then reverses down — you sell. The sweep direction tells you institutional intent. Never predict which direction in advance — simply wait for the sweep to occur and trade the confirmed reversal.
Quick Quiz
1. In a bullish Asia Sweep, which level does price sweep, and in which direction does it then move?
2. What does a bearish Asia Sweep indicate about institutional intent?
3. Should you try to predict in advance whether the Asia Sweep will be bullish or bearish?
The precise entry rules, stop placement, take profit targets, and the best instruments to apply this strategy to.
Entry Rules Step by Step
⏱ 8 min readRules create consistency. Without a clear, repeatable entry process, you will make different decisions each day and never be able to improve systematically. The following six-step entry framework is the core of the Asia Sweep execution model.
The Six-Step Entry Framework
- Mark Asia Range before London open. At or before 07:45 GMT, identify and clearly mark the Asia High and Asia Low on your 15M or 1H chart. Label them. Note the range size in pips.
- Wait for London to sweep one side. From 08:00 GMT, watch price. Do nothing until price breaks beyond the Asia High or Asia Low. Do not anticipate — observe. The sweep must be visible: a clear wick or candle extending beyond your marked level.
- Look for a rejection/reversal candle. After the sweep wick appears, wait for the current candle to close. The closing candle should show clear rejection — the body should close back inside the Asia Range (or at minimum, close strongly away from the sweep level). This candle is your trigger candle.
- Enter after confirmation. For a bullish sweep: enter a buy order above the high of the trigger candle. For a bearish sweep: enter a sell order below the low of the trigger candle. This is a breakout entry from the trigger candle in the direction of the reversal.
- Place stop loss below the sweep wick (bullish) or above it (bearish). Your stop loss goes below the lowest wick of the sweep (for long trades) or above the highest wick (for short trades). This invalidates the setup if hit — price has broken beyond the sweep point with conviction.
- Set take profit at the opposite side of the Asia Range or beyond. TP1 = opposite side of the Asia Range. TP2 = next significant key level, or a 1:3 risk-reward ratio. Move to break-even once TP1 is hit.
There are two common entry approaches: (1) Market entry — enter immediately when the trigger candle closes, at the open of the next candle. Fast but you may get a worse price. (2) Limit entry — place a limit order back toward the rejection level, waiting for a slight pullback before the move continues. Better price but you may miss the trade. Beginners should start with market entries for simplicity.
The Complete Checklist Before Entering
- ☐ Asia Range marked before 08:00 GMT
- ☐ Price has swept beyond the Asia High or Low
- ☐ Sweep occurred between 08:00–10:00 GMT
- ☐ Trigger candle has closed (not mid-candle)
- ☐ Candle body closed back inside the range (or with strong rejection)
- ☐ No high-impact news in the next 30 minutes
- ☐ Risk calculated — position size set to risk no more than 1–2% of account
Before every single trade, calculate your position size. Know the exact pip distance from entry to stop loss. Know how much money that represents at your chosen lot size. Risk only 1–2% of your account per trade. This is not optional. One undisciplined trade can undo weeks of gains.
Six steps: mark range → wait for sweep → identify rejection candle → enter after candle close → stop below sweep wick → TP at opposite Asia Range or 1:3 RR. Always complete your pre-entry checklist. Never trade before the trigger candle closes, and never enter without calculating your risk.
Quick Quiz
1. When should you mark the Asia Range on your chart?
2. For a bullish sweep entry, where should you enter your buy order?
3. What percentage of your account should you risk per trade on this strategy?
Stop Loss and Take Profit
⏱ 7 min readGetting the entry right is half the battle. Knowing how to protect yourself when wrong and maximise your gains when right is the other half. The Asia Sweep strategy has well-defined, logical placement for both stops and targets — they are derived directly from the structure of the setup itself.
Stop Loss Placement
Your stop loss marks the point at which the setup is invalidated. If price returns to this level, the sweep was not a sweep — it was a genuine breakout, or the setup simply failed. Cut the loss and move on.
- Bullish Sweep SL
- Below the lowest wick of the sweep candle. Add 2–3 pips buffer to avoid being stopped by spread noise.
- Bearish Sweep SL
- Above the highest wick of the sweep candle. Add 2–3 pips buffer above the wick high.
Take Profit Targets
The Asia Sweep strategy uses a two-target system, allowing you to bank partial profit while letting the rest run:
| Target | Level | Action on Hit |
|---|---|---|
| TP1 | Opposite side of the Asia Range | Close 50% of position. Move stop to break-even. |
| TP2 | Next key level beyond the Asia Range, or 1:3 RR minimum | Close remaining position. |
Move to Break-Even — This is Non-Negotiable
Once TP1 is hit, you must move your stop loss to your entry price (break-even). This protects your profit on TP1 by ensuring the worst case on the remaining position is zero loss. It also frees you psychologically to let the trade develop toward TP2 without anxiety.
Stop Loss & Take Profit — Worked Example
Risk-Reward Reality Check
On a clean Asia Sweep setup with a tight Asia Range, you should consistently see a minimum 1:2 risk-reward ratio to TP1 alone. This means even with a 50% win rate, the strategy is profitable. Many well-formed setups offer 1:3 or better.
If the distance from entry to your stop loss is larger than the distance from entry to TP1, the trade does not meet the minimum criteria. This happens when Asia Ranges are very wide, or when the sweep wick is very deep. Do not force the trade — skip it and wait for a cleaner setup another day.
SL: below the sweep wick low (bullish) or above the sweep wick high (bearish). TP1: opposite side of Asia Range — close 50% and move SL to break-even. TP2: next key level or 1:3 RR. Always move to break-even at TP1. If the RR to TP1 is less than 1:1.5, the setup does not qualify — skip it.
Quick Quiz
1. Where should your stop loss be placed on a bullish Asia Sweep trade?
2. What should you do when TP1 (the opposite side of the Asia Range) is hit?
3. What is the minimum risk-reward ratio required to TP1 for a trade to qualify?
Best Pairs and Timeframes
⏱ 5 min readThe Asia Sweep strategy works best on specific instruments and timeframes. Applying it to the wrong pair or viewing it on the wrong timeframe will make your results inconsistent and your analysis unreliable. This lesson tells you exactly where to focus.
Best Currency Pairs
The strategy works best on the major forex pairs — those paired with the US dollar or directly involving the currencies most active in the Asian and European sessions:
| Pair | Why It Works Well | Typical Asia Range |
|---|---|---|
| EUR/USD | Tightest spread, highest liquidity, cleanest Asia ranges. The most consistent for this setup. | 15–30 pips |
| GBP/USD | Highly reactive to the London open. Bigger moves but slightly wider spreads. | 20–40 pips |
| USD/JPY | JPY is the Asia session currency — this pair often forms very clean, tight Asia ranges. | 10–25 pips |
| GBP/JPY | More volatile — advanced traders only. Can produce large sweeps but requires wider stops. | 30–60 pips |
When learning this strategy, pick one pair — ideally EUR/USD or USD/JPY — and master it before expanding. Different pairs have different personalities. EUR/USD is the most forgiving for beginners due to its tight spread and liquidity. Once you can consistently identify and trade the setup on one pair, add a second.
Best Timeframes
Use a multi-timeframe approach for this strategy:
- 1H Chart — Context
- Use the 1-hour chart to identify the Asia Range, understand the broader direction, and see where key levels are relative to the range.
- 15M Chart — Entry
- Use the 15-minute chart for your entry timing. The sweep and rejection candles are clearest here. This is where you watch from 08:00 GMT.
- 5M Chart — Precision (Optional)
- Advanced traders may use the 5-minute chart to refine their entry — for instance, looking for a CHoCH (Change of Character) after the sweep. Not recommended for beginners.
Why 15M is Optimal for Entries
The 15-minute chart strikes the right balance between noise and clarity. On the 1-minute or 5-minute chart, every small tick looks significant and you will be tempted to enter too early. On the 1-hour chart, by the time a candle closes, the move may already be 30–40 pips in — making your RR less attractive. The 15M gives you precise entries with manageable noise.
Best pairs: EUR/USD (most consistent), GBP/USD (more volatile), USD/JPY (clean Asia ranges). Start with one pair. Best timeframes: 1H for context, 15M for entries. The 15M chart is where you watch for the sweep and rejection candle. Beginners should master one pair on 15M before complicating the approach.
Quick Quiz
1. Which pair is recommended for beginners learning the Asia Sweep strategy, and why?
2. Why is the 15-minute chart recommended for entries rather than the 1-minute chart?
3. What is the 1-hour chart primarily used for in the Asia Sweep multi-timeframe approach?
Stacking confluence, identifying conditions when the strategy fails, and building a systematic daily playbook for long-term consistency.
Confluence with Other Concepts
⏱ 8 min readThe Asia Sweep is a powerful strategy on its own — but like any strategy, it is more powerful when combined with additional confirming factors. These are called confluence factors: independent pieces of evidence that all point to the same trade outcome. The more confluence you have, the higher the probability of the setup succeeding.
What is Confluence?
Confluence occurs when multiple independent concepts align at the same price level or time window. Each additional factor you can identify increases your confidence in the trade — and reduces the chance that you are seeing a coincidental, low-quality signal.
- FVG (Fair Value Gap)
- An imbalance in price — a three-candle pattern where the middle candle's body doesn't overlap with the first or third candle's wicks, leaving an "unfilled" zone. Price often returns to fill these gaps.
- Order Block
- The last opposing candle before a large institutional move. If the sweep brings price into an order block, the probability of reversal is significantly higher.
- Kill Zone
- Specific high-probability time windows for institutional activity. The London Kill Zone (08:00–10:00 GMT) is the primary window for Asia Sweeps — being within this window is itself a confluence factor.
- HTF Support/Resistance
- A key level on the 4H or Daily chart aligning with the Asia sweep level. Higher timeframe confluence is one of the strongest confirming factors.
The Three Highest-Value Confluence Combinations
When the Asia sweep takes price into a Fair Value Gap (FVG) — an imbalance left by a previous institutional move — the probability of reversal from that specific level increases significantly. The FVG acts as a magnet that was already drawing price there; the sweep fills the FVG and then rejects sharply.
If the sweep wick takes price directly into a well-defined order block (OB) — especially a bullish OB at the sweep low for a bullish setup — this is one of the strongest signals in the strategy. The OB is where institutional buyers previously entered; they are likely to defend that zone again.
The sweep occurring within the first 1–2 hours of the London open (the Kill Zone) is itself a form of confluence — you are aligned with the period of maximum institutional activity. A sweep that occurs at 09:30 GMT is far stronger than one at 12:00 GMT.
Scoring Your Setup
Before entering, mentally score your setup on the number of confluence factors present:
| Confluence Count | Setup Quality | Position Sizing |
|---|---|---|
| 1 factor (sweep alone) | Standard | Standard size (1% risk) |
| 2 factors | Good | Standard to 1.5% risk |
| 3+ factors | High Conviction | Up to 2% risk (your maximum) |
- FVG at sweep level = strong confluence
- Order Block at sweep level = strong confluence
- Sweep within Kill Zone (08:00–10:00 GMT) = timing confluence
- HTF (4H/Daily) support or resistance = structural confluence
- Never increase beyond 2% risk regardless of confluence count
Quick Quiz
1. What is "confluence" in the context of trading?
2. If a sweep brings price directly into a Fair Value Gap, what does this indicate?
3. What is the maximum risk per trade recommended regardless of how many confluence factors are present?
Days When It DOESN'T Work
⏱ 6 min readKnowing when not to trade is just as important as knowing how to trade. The Asia Sweep is a high-probability strategy — but it is not a guaranteed daily income machine. There are specific conditions that reliably reduce its effectiveness. Recognising these conditions and stepping aside on those days is a mark of a disciplined, professional approach.
Conditions That Invalidate the Setup
News events like Non-Farm Payrolls (NFP — first Friday of the month), FOMC rate decisions, and CPI releases create extreme, unpredictable volatility that overrides all technical setups. Do not trade the Asia Sweep on these days. Check Forex Factory or your broker's calendar daily — if there is a red-folder event in the morning session, consider staying out.
Monday's Asia session often follows a weekend of news, gap-opens, and repositioning. The Asia Range on Mondays is frequently irregular — either too wide (due to gap opens) or forming at unusual levels. The first hour of London on Mondays also tends to be choppy and directionless. Many experienced Asia Sweep traders simply do not trade Mondays.
From approximately 14:00 GMT onwards on Fridays, many institutional traders close positions ahead of the weekend. Volume drops, spreads widen, and price action becomes erratic. If you have not already entered your Asia Sweep trade by 12:00 GMT on a Friday, consider stepping aside for the day.
A very wide Asia Range suggests something significant happened during the session — perhaps a central bank announcement, an unexpected geopolitical event, or unusually high overnight volatility. In these conditions, the "range" is not a clean consolidation and the sweep levels are less defined. The stop-loss placement also becomes uncomfortably wide. Skip these days.
The Choppy Market Problem
Some days, price will sweep the Asia Low, appear to reverse, then sweep the Asia High, then reverse again — multiple false sweeps with no clean follow-through. This is a choppy, directionless market. The Asia Sweep requires a single, clean directional move after the sweep. If you take two stop losses in a row on a given morning, stop trading for the day. The market is not behaving in a structured way.
Your Weekly Pre-Market Routine
Every Sunday evening or Monday morning, spend 10 minutes reviewing the week ahead:
- Check the economic calendar for high-impact news events (NFP, FOMC, CPI, GDP)
- Note which days have 08:00–12:00 GMT red-folder events — mark them as "no-trade days"
- Note any central bank meetings or speeches during the London morning
- Flag any major geopolitical developments that may affect market behaviour
Do not trade the Asia Sweep on: high-impact news days (NFP, FOMC, CPI), Mondays (irregular Asia ranges), Friday afternoons (low volume, erratic action), or days with very wide Asia Ranges (>60 pips on EUR/USD). Check the economic calendar every Sunday. Knowing when NOT to trade is as valuable as knowing when to trade.
Quick Quiz
1. Why should you avoid trading the Asia Sweep on NFP (Non-Farm Payrolls) day?
2. Why are Mondays problematic for the Asia Sweep strategy?
3. If you take two consecutive stop losses on an Asia Sweep attempt in the same morning, what should you do?
Building Your Asia Sweep Playbook
⏱ 8 min readYou now have all the components of the Asia Sweep strategy. The final step is assembling them into a daily routine — a personal playbook that transforms theory into consistent, repeatable execution. A playbook eliminates decision fatigue, enforces discipline, and creates the data you need to improve over time.
Your Daily Trading Routine
Asia Sweep Daily Playbook
The Importance of Journalling
Every professional trader journals every trade. Without a journal, you are flying blind — you cannot see your patterns of mistakes, you cannot measure whether your strategy is actually working, and you cannot improve. Your journal should include:
- Date, pair, and session
- Asia Range size (pips)
- Sweep direction (bullish/bearish)
- Entry, stop, and target levels
- Confluence factors present
- Outcome (profit/loss in pips and %)
- Screenshot of the chart at entry and exit
- Notes: what went well, what could be improved
Building a Sample Size Before Sizing Up
Do not increase your position size until you have a meaningful sample of results. 30 trades is the minimum before drawing any conclusions. This takes roughly 6–8 weeks of trading at one trade per day. Once you have 30+ trades in your journal:
- Calculate your win rate (trades won ÷ total trades)
- Calculate your average risk-reward (average winner ÷ average loser)
- Calculate your expectancy = (Win Rate × Avg Win) − (Loss Rate × Avg Loss)
- If expectancy is positive, the strategy is working — consider a very gradual size increase
If your win rate is 50% and your average RR is 1:2, your expectancy is positive — meaning the strategy will make money over time if you stick to the rules. You do not need a 70%+ win rate to be profitable. Consistent execution of a positive-expectancy strategy is the goal.
Before risking real money, spend two weeks backtesting the strategy. Go back through historical charts and identify where Asia Sweeps occurred. Mark your entries, stops, and targets as if you had taken them live. Count wins and losses. This builds pattern recognition and gives you confidence in the setup — without the emotional pressure of real money on the line.
Your daily routine: mark Asia Range at 07:45 GMT → London open at 08:00 GMT → execute or skip by 10:00 GMT → journal every session. Track your win rate, RR, and expectancy over 30+ trades before sizing up. Backtest before trading live. A clear playbook eliminates emotional decision-making and turns strategy into a repeatable process.
Quick Quiz
1. How many trades is the minimum recommended sample size before drawing conclusions about your performance?
2. If you have a 50% win rate with an average risk-reward of 1:2, is the strategy profitable?
3. What should you include when journalling a trade?
4. When should you stop the execution window for the Asia Sweep each day?
Asia Sweep Strategy — Complete!
You have finished all 12 lessons. You now have a complete framework for identifying, executing, and managing the Asia Sweep strategy. The next step is practice: backtest, journal, and trade live with discipline.