Before you can trade trendlines, you need to understand exactly what they are, why they work, and how to draw them correctly.
What is a Trendline?
⏱ 5 min readA trendline is one of the oldest and most intuitive tools in all of technical analysis. At its simplest, it's a straight diagonal line drawn on a chart that follows the direction price is moving. It connects a series of price points — highs or lows — to show you where price has been respecting a consistent path.
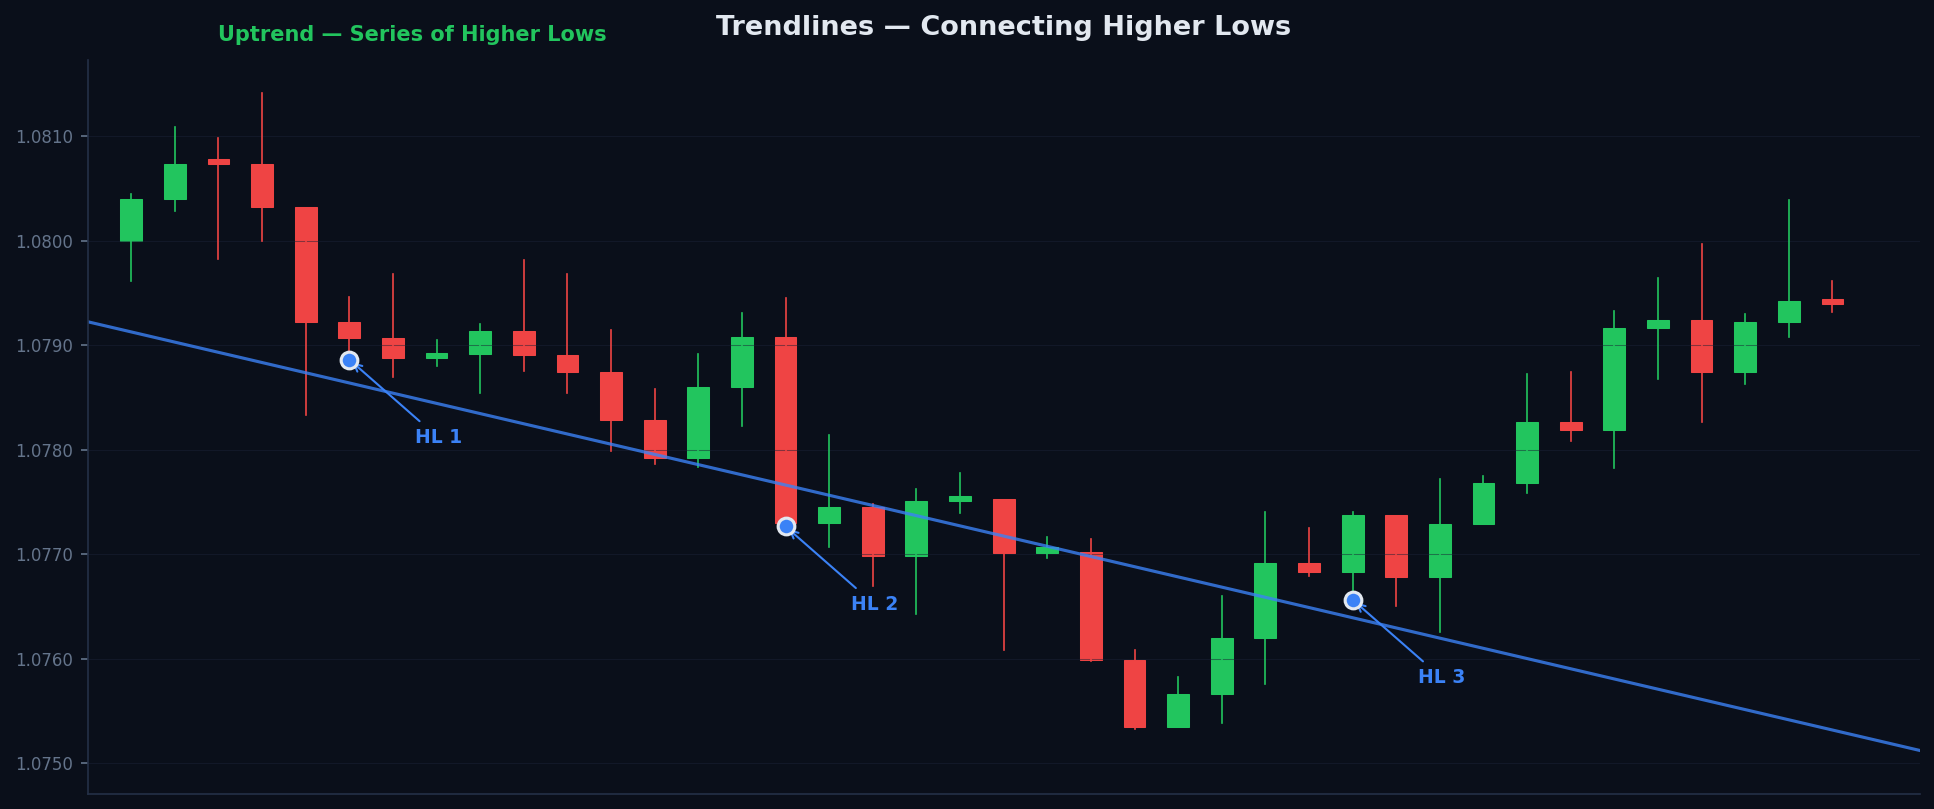
An uptrend trendline connects the series of higher swing lows — each time price pulls back and holds the line, it confirms the trend is intact
Why Are Trendlines So Powerful?
Unlike horizontal support and resistance lines, trendlines are dynamic — they move with price. A horizontal support level sits at a fixed price (say £1.2500) forever. But a trendline climbs higher alongside the market, always at a slightly different price depending on when you look at it. This is what makes them so useful: they capture the momentum of a move, not just a static level.
Trendlines work because they represent areas where buyers (in an uptrend) or sellers (in a downtrend) consistently step in to push price back in the trend direction. Each time price touches the trendline and bounces, it reinforces the line's significance. It becomes a self-fulfilling level — more traders see it, more traders act on it, and so it keeps working.
Trendlines vs Horizontal Support & Resistance
- Horizontal S&R
- Fixed price level. Stays at the same price indefinitely. Best used in ranging, sideways markets.
- Trendline
- Diagonal, moving level. Rises in uptrends, falls in downtrends. Best used when price is trending.
- Uptrend Trendline
- Connects swing lows (where price bounced upward). Acts as dynamic support beneath price.
- Downtrend Trendline
- Connects swing highs (where price was rejected downward). Acts as dynamic resistance above price.
Trendlines have been used by traders for well over a century. Charles Dow, the founder of Dow Theory (late 1800s), understood price trends as a series of successive highs and lows — the foundational concept behind every trendline drawn today.
A trendline is a diagonal line connecting swing highs (downtrend) or swing lows (uptrend). Unlike horizontal support and resistance, trendlines move with price — they are dynamic levels. They work because they represent areas where buyers or sellers repeatedly step in, making them self-reinforcing over time.
- Trendline = diagonal line following the direction of price movement
- Uptrend trendline: connects swing lows → acts as dynamic support
- Downtrend trendline: connects swing highs → acts as dynamic resistance
- Trendlines are dynamic (they move with price); horizontal S&R is static
- Each bounce off a trendline reinforces its importance
Quick Quiz
1. What is the key difference between a trendline and a horizontal support level?
2. In an uptrend, which price points does a trendline connect?
3. Why do trendlines often become self-fulfilling?
4. A downtrend trendline acts as dynamic...
Drawing a Valid Trendline
⏱ 7 min readThis is where beginners often go wrong. Drawing a trendline sounds simple — just connect some dots with a line — but there are specific rules that separate a valid, tradeable trendline from a random line that's likely to be ignored by the market.
The Golden Rule: Minimum Two Touch Points
You cannot draw a trendline from a single point. You need a minimum of two confirmed touch points to define the line — and ideally three or more to validate it. Here's why:
- 1 point: Just a starting point. No line yet — you can draw infinite lines through one point.
- 2 points: You have a line. This is the minimum for drawing a trendline, but it's tentative.
- 3 points: Now it's a valid trendline. Price has returned to and respected the line three times — this is significant.
- 4+ points: A very strong, high-conviction trendline. The more touches, the more powerful.
The most common mistake is forcing a trendline to fit where you want it to be. If the line doesn't connect cleanly through the swing points without cutting through candle bodies — it's not valid. A valid trendline fits the chart naturally. If you're bending it to make it work, leave it alone.
Wicks vs Bodies: What Should You Connect?
This is a genuine debate amongst traders, and there's no single universally correct answer. Both approaches have merit:
| Method | How It Works | Best For |
|---|---|---|
| Connecting wicks (highs/lows) | Use the absolute high or low of the candle including the wick | Capturing the full price rejection area; useful on higher timeframes |
| Connecting bodies (open/close) | Use candle body closes; ignore wick extremes | Smoother lines with fewer false touches; preferred for entry precision |
In practice, many experienced traders do both — drawing one line through wicks and one through bodies — to create a trendline zone rather than a precise single line. Price bouncing within this zone is considered a valid touch.
Step-by-Step: Drawing a Trendline
- Identify whether the market is in an uptrend or downtrend by looking at the overall price direction.
- For an uptrend, locate two clear swing lows (points where price bounced upward). For a downtrend, locate two swing highs (points where price was rejected downward).
- Draw a straight line through those two points, extending it to the right.
- Check: does the line cut through any candle bodies between the two points? If yes, adjust or abandon — it's not a clean trendline.
- Wait for a third touch. If price returns to the line and bounces again, the trendline is confirmed and tradeable.
Avoid These Common Mistakes
- Using too-steep angles: A trendline angled at 80° is unsustainable — price can't maintain that pace. Steep trendlines break quickly. Gentler, shallower lines are usually more durable.
- Using too many lines at once: If your chart looks like a spider's web, you're cluttering it. Draw the most obvious, dominant trendlines only.
- Ignoring the timeframe context: A trendline on a 1-minute chart is far weaker than one on a daily chart. Always be aware of which timeframe your line is drawn on.
- Moving the line to fit recent price: Once drawn, don't adjust the trendline to avoid a break. If price closed through it, the line broke.
A valid trendline requires a minimum of two touch points (three is ideal). Connect swing lows in uptrends, swing highs in downtrends. The line must not cut through candle bodies. Don't force it — if it doesn't fit naturally, it isn't valid. More touches = stronger trendline.
- Minimum 2 touch points to draw; 3 to validate; 4+ = very strong
- Uptrend: connect swing lows. Downtrend: connect swing highs.
- Line must not cut through candle bodies between touch points
- Wicks vs bodies — use both to create a trendline zone
- Avoid steep trendlines; gentler angles are more durable
Quick Quiz
1. What is the minimum number of touch points needed to draw a valid trendline?
2. If a drawn trendline cuts through candle bodies between touch points, what should you do?
3. Why are very steep trendlines (near-vertical) generally less reliable?
Uptrend vs Downtrend Trendlines
⏱ 6 min readEvery trendline falls into one of three categories, and knowing which type you're looking at determines how you trade it. Before you draw any line, your first job is to read the overall character of the market.
The Three Market States
- Uptrend
- Price is making higher highs and higher lows. Bulls are in control. The trendline sits beneath price as ascending support, connecting the rising swing lows.
- Downtrend
- Price is making lower highs and lower lows. Bears are in control. The trendline sits above price as descending resistance, connecting the falling swing highs.
- Range / Sideways
- Price is making roughly equal highs and lows. Neither bulls nor bears dominate. No trendline needed here — use horizontal support and resistance instead.
Uptrend Trendlines — Ascending Support
In an uptrend, each pullback is a buying opportunity. The trendline marks the area where buyers are willing to step back in after each retracement. Key characteristics:
- Line slopes upward (positive angle)
- Connects the swing lows — the bottoms of each pullback
- Price should remain above the line during a healthy uptrend
- A decisive close below the line signals the uptrend may be over
Downtrend Trendlines — Descending Resistance
In a downtrend, each rally is a selling opportunity. The trendline marks the area where sellers step back in to push price lower after each bounce. Key characteristics:
- Line slopes downward (negative angle)
- Connects the swing highs — the tops of each relief bounce
- Price should remain below the line during a healthy downtrend
- A decisive close above the line signals the downtrend may be ending
What to Do in a Sideways Market
If price is ranging — bouncing between a flat ceiling and a flat floor — trendlines are the wrong tool. Switch to horizontal support and resistance. Mark the flat top of the range (resistance) and the flat bottom (support), and trade bounces between them. Trying to draw a diagonal trendline on a sideways market will only confuse you.
| Market Type | Price Structure | Tool to Use | Trade Direction |
|---|---|---|---|
| Uptrend | Higher highs + higher lows | Ascending trendline (under lows) | Long only (buy dips) |
| Downtrend | Lower highs + lower lows | Descending trendline (over highs) | Short only (sell rallies) |
| Range | Equal highs + equal lows | Horizontal support & resistance | Both — buy support, sell resistance |
Uptrend trendlines connect rising swing lows and act as ascending support. Downtrend trendlines connect falling swing highs and act as descending resistance. In a flat/sideways market, skip the trendline entirely and use horizontal support and resistance instead. Always identify the market state before drawing any line.
- Uptrend = higher highs + higher lows → ascending trendline under swing lows
- Downtrend = lower highs + lower lows → descending trendline over swing highs
- Flat/range = use horizontal S&R, not trendlines
- In an uptrend: price should stay above the trendline
- In a downtrend: price should stay below the trendline
Quick Quiz
1. In a downtrend, which price points does a trendline connect?
2. If a market is making roughly equal highs and lows, which tool should you use?
3. In a healthy uptrend, price should generally be...
4. What does a decisive candle close below an ascending trendline suggest?
The bounce is the core trendline trade. Learn the exact setup, the confirmation signals you need, and how to manage your risk properly.
The Trendline Bounce Setup
⏱ 8 min readThe trendline bounce is the most fundamental trendline trade. The idea is beautifully simple: price has been respecting the trendline, so when it comes back to it again, you look to trade in the direction of the trend. You're not fighting the market — you're aligning with it.
The Core Bounce Setup — Step by Step
- Identify a valid trendline with at least 2–3 confirmed touch points. The more touches, the stronger the line.
- Wait for price to pull back towards the trendline. In an uptrend, price will sell off from its most recent high back down towards the rising trendline.
- Look for a 3rd (or subsequent) touch of the trendline. This is your potential entry zone.
- Wait for a rejection candle at the trendline — do NOT enter just because price touched the line. See Lesson 2.2 for confirmation signals.
- Enter on the bounce — once confirmation appears, enter in the direction of the trend (long in uptrend, short in downtrend).
- Place your stop loss just beyond the trendline (a few pips below it in an uptrend, above it in a downtrend) to account for wick spikes.
- Set your take profit at the previous swing high (uptrend) or swing low (downtrend) — the last structural high/low before the pullback.
Example: Uptrend Bounce Trade
📊 Trade Example — GBP/USD Uptrend Bounce
Why the 3rd Touch Matters
The first touch defines one point. The second touch confirms the line. But the third touch is where the real trading opportunity begins. By this point, the market has demonstrated three times that it's willing to respect this level. That's tradeable evidence — not just a hope.
Many professional traders skip the first two touches entirely and only ever trade from the third touch onwards. The extra patience is rewarded with higher-probability setups.
Entering the moment price reaches the trendline — without waiting for a rejection signal — is one of the most common beginner errors. Price could simply continue through the trendline and keep going. Always wait for confirmation that the market is actually rejecting the level. Patience is an edge.
The trendline bounce setup: identify a valid trendline → wait for price to pull back to it → look for a 3rd+ touch → wait for a rejection candle → enter in the trend direction → SL beyond the trendline → TP at the previous swing high/low. Never enter just because price touched the line.
- Bounce setup: valid trendline → pullback → 3rd+ touch → rejection candle → entry
- Enter in the direction of the trend (long in uptrend, short in downtrend)
- SL: just beyond the trendline (with a small wick buffer)
- TP: previous swing high (uptrend) or swing low (downtrend)
- 3rd touch = minimum for trading; the more touches the better
Quick Quiz
1. In the trendline bounce setup, where should you place your Take Profit?
2. Why is the 3rd touch of a trendline particularly significant?
3. Where should your Stop Loss be placed on an uptrend bounce trade?
4. What is the biggest mistake beginners make with the bounce setup?
Entry Confirmation Signals
⏱ 7 min readThis is where the discipline separates good traders from average ones. You have a valid trendline. Price has come back to it for a 3rd touch. Now what? You wait. Not for any arbitrary amount of time — but for a specific candle pattern that tells you the market is actually rejecting the trendline, not just touching it and continuing through.
The Three Most Reliable Confirmation Signals
- Pin Bar (Hammer / Shooting Star)
- A candle with a long wick pointing towards the trendline and a small body away from it. The wick shows price was pushed into the trendline and immediately rejected. One of the strongest single-candle signals.
- Engulfing Candle
- A strong candle that completely engulfs the previous candle's body. A bullish engulfing at an uptrend trendline (or bearish engulfing at a downtrend trendline) shows a decisive shift in momentum.
- Doji + Strong Follow Candle
- A doji (indecision candle) forms right at the trendline, followed by a strong directional candle. The doji shows the battle — the follow candle shows who won. Enter on the open of the third candle or on a pullback.
Reading a Pin Bar at a Trendline
A pin bar is arguably the most intuitive confirmation signal. Here's exactly what it tells you:
- Price pushed into and below the trendline (the long wick)
- But buyers flooded in and pushed it back above the trendline before the candle closed
- The candle closes above the trendline — showing buyers won the battle
- The long wick below the line represents the rejected price level
For a downtrend trendline, the logic reverses: the pin bar has a long upper wick into the trendline, and closes below it — showing sellers won.
What is NOT Confirmation
Being precise about what does not count as confirmation is just as important:
- Price merely touching the trendline — a touch without a rejection candle is not confirmation
- A small indecision candle alone (without follow-through) — wait for the next candle to confirm direction
- A gap near the trendline — gaps can look like rejections but are often just liquidity issues
- Your gut feeling — "it looks like it's bouncing" is not a signal. You need a candle pattern.
The strongest entries have more than one confirmation factor. A pin bar at a trendline is good. A pin bar at a trendline that also coincides with a previous horizontal support level is excellent. A pin bar at a trendline + horizontal support + inside a kill zone is elite. The more factors align, the higher the probability.
Entry Timing Options
| Entry Method | How It Works | Pro | Con |
|---|---|---|---|
| Aggressive Entry | Enter as the confirmation candle forms (before it closes) | Better price, larger RR | Higher risk — candle may not confirm |
| Conservative Entry | Wait for the candle to close, then enter on the next candle's open | Confirmed signal, lower risk of false entry | Slightly worse price, smaller RR |
| Limit Order Entry | Place a limit order at the 50% retracement of the confirmation candle | Excellent price, maximum RR | May miss the trade if price doesn't retrace |
Never enter a trendline bounce just because price touched the line. Wait for confirmation: a pin bar, engulfing candle, or doji followed by a strong directional candle. The confirmation proves the market is rejecting the trendline, not just grazing it. Multiple confluences make the signal stronger.
- Three main confirmations: pin bar, engulfing candle, doji + follow candle
- Pin bar: long wick into trendline, close on the other side = strong rejection
- Engulfing: previous candle fully swallowed by the new candle = momentum shift
- Always wait for candle to close before acting (conservative approach)
- More confluences = stronger signal (trendline + S&R + kill zone = elite)
Quick Quiz
1. A pin bar at an uptrend trendline shows what?
2. Which of these does NOT count as a valid entry confirmation?
3. What is the advantage of the conservative entry method (waiting for candle close)?
Risk Management on Trendline Trades
⏱ 6 min readEven the best trendline setup in the world means nothing without proper risk management. Trendlines break — that's a fact of trading life. Your job is to ensure that when they do, you lose an acceptable, pre-defined amount, and when the trade works out, you make significantly more than you risked.
Stop Loss Placement
Your stop loss should be placed just beyond the trendline — not on it, and not miles away from it. The logic: if price decisively breaks through the trendline, your trade thesis is wrong and you want to be out quickly.
- Uptrend bounce: Place SL a few pips/points below the trendline. Add extra buffer to account for wick spikes that might briefly pierce the line without actually breaking it.
- Downtrend bounce: Place SL a few pips/points above the trendline. Same wick buffer rule applies.
- How much buffer? Enough to survive a typical wick beyond the line on your timeframe. On a 1-hour chart, 5–10 pips may be appropriate. On a 4-hour chart, 15–25 pips might be needed. Look at recent wick sizes as a guide.
One of the most dangerous habits is moving a stop loss further away "just in case." This corrupts your risk management. If the trendline breaks, exit cleanly. Widening your stop doesn't save the trade — it just increases how much you lose when it eventually fails.
The 1:2 Minimum Risk-to-Reward Ratio
On trendline bounce trades, you should aim for a minimum of 1:2 risk-to-reward (RR). This means for every 1 pip/point you risk, you target at least 2 pips/points of profit.
Risk:Reward = Stop Loss Distance ÷ Take Profit Distance
Example: SL = 30 pips, TP = 60 pips → RR = 1:2 ✓
Why 1:2 minimum? Because even if you're only right on 40% of your trades, a 1:2 RR keeps you profitable overall. It builds a mathematical edge over time.
Before You Enter: The Pre-Trade Checklist
- Is there a valid trendline with at least 3 touch points?
- Has a confirmation candle formed at the trendline?
- Is my stop loss placement defined and logical (just beyond the trendline)?
- Is there a clear Take Profit at the previous structural swing?
- Is my Risk:Reward ratio at least 1:2?
- Am I trading in the direction of the overall trend?
- Is my position size correct so that if SL hits, I lose no more than 1–2% of my account?
Position Sizing — How Many Lots to Trade
Your position size should always be determined by your stop loss distance and the percentage of your account you're willing to risk — never by a "gut feel" on lot size. A common starting formula:
Position Size = (Account Balance × Risk %) ÷ (Stop Loss in Pips × Pip Value)
Risk 1% of £10,000 = £100. SL = 40 pips, pip value = £0.10 per mini lot → Position = £100 ÷ (40 × 0.10) = 25 mini lots
Place your SL just beyond the trendline with a small wick buffer. Aim for a minimum 1:2 risk-to-reward ratio on every trendline bounce trade. Always define your risk before entering — never after. Use the pre-trade checklist every time. Risk only 1–2% of your account per trade.
- SL: just beyond the trendline + a small wick buffer
- TP: previous structural swing high (uptrend) or swing low (downtrend)
- Minimum RR = 1:2 on trendline bounce trades
- Never move SL further away to avoid being stopped out
- Risk 1–2% of account per trade maximum
- Run the pre-trade checklist on every single setup
Quick Quiz
1. On an uptrend trendline bounce trade, where precisely should the Stop Loss go?
2. If your Stop Loss is 25 pips and you want a minimum 1:2 RR, what is the minimum Take Profit in pips?
3. A trader is stopped out and moves their SL further away to give the trade "more room." What is wrong with this?
4. What maximum percentage of your account should you typically risk on a single trendline trade?
Trendlines don't last forever. Learn to recognise genuine breaks, trade them profitably, and avoid the dangerous false breaks that trap traders.
When Trendlines Break
⏱ 6 min readNo trend lasts forever. Every trendline, no matter how strong, will eventually be broken. When it breaks, it's not just a line on your chart failing — it's a potential signal that the balance of power between buyers and sellers has shifted. Recognising a genuine break early puts you ahead of the crowd.
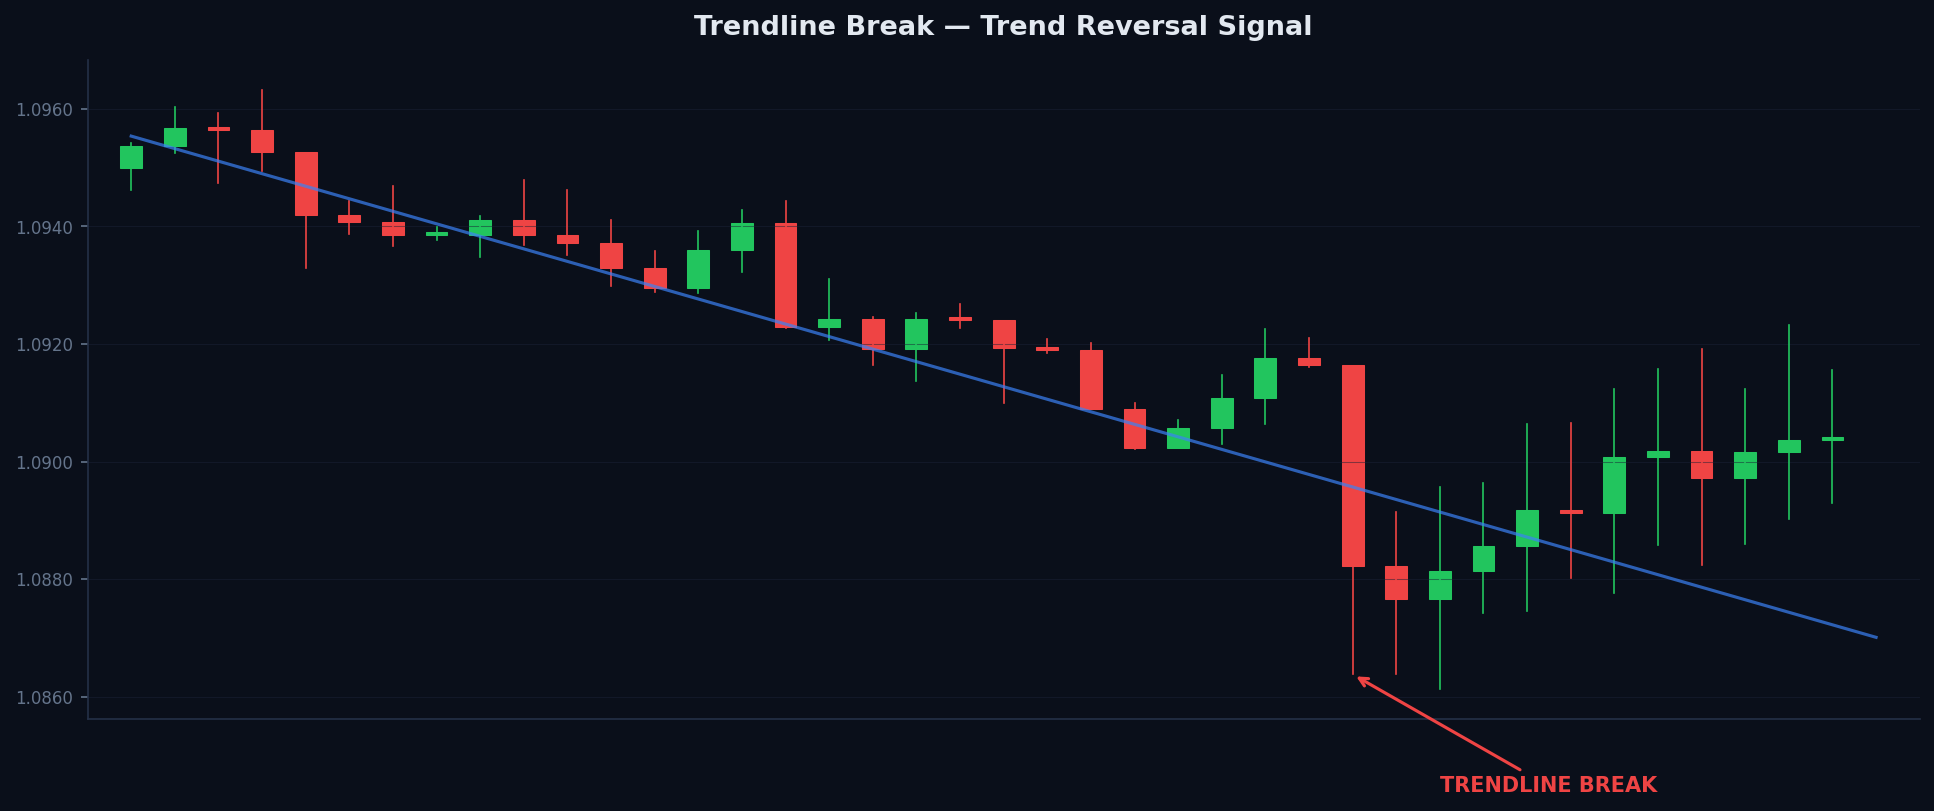
A decisive close through the trendline — note the strong candle body that closes well beyond the line, confirming the break rather than a mere wick spike
What Constitutes a Real Break?
Not every time price moves beyond a trendline is a genuine break. Here's the key distinction:
- Genuine Break
- A candle closes decisively beyond the trendline. The body of the candle is through the line, not just the wick. Price doesn't return within 1–2 candles.
- False Break (Fakeout)
- Price temporarily moves beyond the trendline — usually with a wick — but then closes back on the original side. The trendline is still intact. See Lesson 3.3.
- The Test to Apply
- Ask: did the candle body close through the trendline? If yes, treat it as a break. If only the wick crossed, remain cautious.
Momentum and Volume as Confirmation
A strong trendline break typically comes with visual evidence of momentum. Look for:
- A large-bodied candle cutting through the trendline — not a small, tentative candle
- Increased activity on the breakout candle (visible as a larger candle relative to recent ones)
- The candle closing near its extreme (breaking candle closes near its high/low with little wick on the break side) — this shows conviction
- Follow-through on the next candle — if the next candle also moves in the break direction, it confirms the break is real
What Happens After a Break
After a genuine trendline break, one of three things tends to happen:
- Direct reversal: Price breaks the trendline and continues in the new direction — the old trendline has become irrelevant. This is the fastest-moving scenario.
- Break and retest: Price breaks the trendline, moves away, then returns to retest the broken trendline from the other side before continuing. This is the highest probability scenario to trade (covered in Lesson 3.2).
- Chop: Price breaks the trendline but then enters a sideways range, neither continuing the trend nor reversing cleanly. Patience required here — wait for a clear new structure before trading.
A trendline break on a 15-minute chart is far less significant than the same break on a weekly chart. Always consider which timeframe you're looking at. A break of a minor intraday trendline might just be noise within a bigger trend — check the higher timeframe to understand whether the break matters.
A genuine trendline break requires a candle to close decisively beyond the line — not just spike through it. Look for a large-bodied candle with follow-through on the next candle. After a break, expect either a direct reversal, a break-and-retest, or a period of chop. The break-and-retest is the highest-probability trading opportunity.
- A real break = candle body closes beyond the trendline
- Wick-only crosses are not confirmed breaks — wait for a close
- Confirmation: large candle, body closes near extreme, follow-through
- Three outcomes after a break: direct reversal, retest, or chop
- The break-and-retest setup is the highest-probability trade
Quick Quiz
1. Which of the following best describes a genuine trendline break?
2. What is the key test for determining whether a trendline has genuinely broken?
3. After a genuine trendline break, which of the three outcomes is considered the highest-probability trade?
Trading the Break and Retest
⏱ 8 min readThe break-and-retest is widely considered the highest-probability trendline trade. Rather than chasing the breakout as it happens (which is often violent and difficult to enter cleanly), you wait patiently for price to come back to the broken trendline and retest it from the other side. This gives you a much cleaner entry with better risk-to-reward.
Why Does the Retest Happen?
When a trendline breaks, a fascinating role-reversal occurs. In an uptrend, the trendline was acting as support below price. Once it breaks, that same level often becomes resistance above price — the old support has flipped to resistance. This is a fundamental concept in technical analysis known as polarity flip.
The Break-and-Retest Setup — Step by Step
- Identify the break: A candle body closes decisively beyond a valid trendline. Mark the trendline level at this point.
- Wait for follow-through: Let price move away from the trendline in the break direction. The further it moves, the stronger the break signal.
- Watch for the retest: Price returns towards the broken trendline — now acting in its new role (support broken → new resistance; resistance broken → new support).
- Wait for confirmation at the retest: Just like a bounce trade, look for a rejection candle (pin bar, engulfing, or doji + follow candle) when price reaches the retested trendline.
- Enter on confirmation: Trade in the direction of the break (if support broke → sell; if resistance broke → buy).
- SL above/below the retested trendline. TP at the next structural level in the direction of the move.
📊 Break-and-Retest Example — EUR/USD
Why This Trade is So Good
The break-and-retest has several properties that make it particularly attractive:
- Patience is built in: You wait for the market to come back to you — no chasing required
- Tight stop loss: The SL only needs to be just beyond the retested level, giving excellent RR
- Confluence: The broken trendline is now both an old support/resistance AND a new resistance/support — double confirmation
- High-probability: The polarity flip is one of the most consistently observed phenomena in market structure
The retest doesn't always happen. Sometimes price breaks through a trendline and never looks back — it just keeps running. If you miss the break-and-retest because price didn't retest, move on to the next trade. Never chase. There will always be another setup.
The break-and-retest: wait for a confirmed trendline break → wait for price to return and retest the broken trendline from the other side → wait for a rejection candle at the retest → enter in the direction of the break. The broken trendline flips polarity — old support becomes new resistance, and vice versa.
- Break-and-retest = highest probability trendline trade
- Polarity flip: old support becomes new resistance (and vice versa)
- Five steps: break → follow-through → retest → confirmation → entry
- SL: just beyond the retested trendline level
- Not all breaks get a retest — if missed, don't chase; move on
Quick Quiz
1. In the break-and-retest setup, what is a "polarity flip"?
2. After an uptrend trendline breaks, you wait for the retest. What are you now trading?
3. What should you do if a trendline breaks but there is no retest before price continues?
False Breaks and How to Avoid Them
⏱ 7 min readA false break — sometimes called a "fakeout" or a "stop hunt" — is when price momentarily moves beyond a trendline, triggers stop losses and premature entries, then reverses back inside the trendline. It's one of the most frustrating and common traps in trading. Learning to distinguish false breaks from genuine ones is a critical skill.
What a False Break Looks Like
False breaks are characterised by one key feature: a wick that crosses the trendline, but a candle body that closes back on the original side.
- The Setup
- Price approaches an established trendline with momentum. It pushes through the line, triggering stop losses of traders holding positions.
- The Tell
- Despite crossing the trendline intracandle, the candle closes back inside the trendline — often forming a pin bar in the process.
- What Happens Next
- Price resumes the original trend direction, often with renewed momentum as the triggered stop losses add fuel to the move.
The #1 Rule: Wait for a Candle Close
The single most effective way to avoid false breaks is devastatingly simple: never act on a trendline break until the candle has fully closed.
If you're watching the 1-hour chart and you see price push through a trendline mid-candle, do not enter. Wait for that candle to close. If it closes beyond the trendline with a strong body, the break is confirmed. If it wicks through and closes back inside, it was a false break — and you just saved yourself from a losing trade.
Additional Filters for Avoiding False Breaks
- Require a second confirming candle: After the break candle closes, wait for the next candle to also close in the break direction before entering. Two closes beyond the trendline is significantly more reliable.
- Check the momentum: A genuine break usually has a large, confident candle. A timid, small candle pushing just slightly through a trendline is often a false break.
- Look for confluence: If the trendline is also at a major horizontal support/resistance level, a false break becomes even more likely. Strong levels produce strong rejections.
- Use higher timeframe context: If the higher timeframe trend is in the opposite direction to the break, treat any break as suspicious. It may be a false break engineered by the larger trend.
How False Breaks Can Actually Become Trades
Here's the interesting flip side: once you recognise a false break, it often becomes a powerful trade in the opposite direction. A pin bar that wicks through an uptrend trendline and closes back above it isn't a break — it's a strong bounce confirmation. The very fact that it tried to break and failed shows buyer strength. You can enter long on the next candle's open with a tight stop below the wick low.
Some traders see price approaching a trendline and preemptively enter a breakout trade before the break even happens. This is gambling, not trading. You must wait for the break to actually occur — and close — before acting. Anticipating breaks is one of the fastest ways to blow through your account.
False breaks (fakeouts) are wicks that cross a trendline but close back inside it. The #1 rule: always wait for a candle to close beyond the trendline before treating it as a real break. Use additional filters: a second confirming candle, check momentum strength, look for confluence, and consider the higher timeframe. False breaks can also be traded as powerful bounce setups in the opposite direction.
- False break = wick through trendline but candle closes back inside → trendline intact
- #1 rule: wait for candle to fully close before acting on any break
- Extra confirmation: wait for a second candle to close beyond the line
- Small/timid breakout candles → often false breaks
- False break that closes back inside = powerful bounce setup in the opposite direction
Quick Quiz
1. What is the defining feature of a false break (fakeout)?
2. How do you avoid being caught by a false break?
3. When a false break occurs (wick through trendline that closes back inside), what trading opportunity does it create?
4. Which type of breakout candle should you be most suspicious of?
Take your trendline trading to the next level with channels, multi-timeframe analysis, and powerful strategy combinations.
Trendline Channels
⏱ 7 min readWhen price isn't just following a single trendline but is contained between two parallel trendlines, you have a channel. Channels are one of the most satisfying structures to trade because they give you both a buy zone (the lower trendline in an ascending channel) and a sell zone (the upper trendline in an ascending channel) with clear, pre-defined risk levels.
The Three Types of Channel
- Ascending Channel
- Both trendlines slope upward. The lower line connects swing lows (support); the upper line is drawn parallel, connecting swing highs (resistance). Price bounces between them, moving generally higher.
- Descending Channel
- Both trendlines slope downward. The upper line connects swing highs (resistance); the lower line is drawn parallel, connecting swing lows (support). Price moves generally lower.
- Horizontal Channel
- Both lines are flat (parallel horizontal). This is just a range — same as trading horizontal support and resistance. Neither a classic trendline channel nor a trend.
Drawing a Channel
Once you've drawn your primary trendline (e.g., the support line of an ascending channel), creating the channel is straightforward:
- Draw your primary trendline (connecting swing lows in an uptrend).
- Identify the most prominent swing high between your touch points.
- Draw a line parallel to your primary trendline that passes through that swing high — this is your channel resistance.
- If price subsequently touches this parallel resistance line, the channel is confirmed.
Trading Within a Channel
The channel trading strategy is simple but requires patience and precision:
- Buy at the lower trendline (support) when price pulls back to it — look for the same confirmation candles as a regular trendline bounce (pin bar, engulfing).
- Target the upper trendline (resistance) as your Take Profit.
- Sell at the upper trendline (resistance) when price reaches it — again, look for confirmation first.
- Target the lower trendline as Take Profit.
- Stop loss on buys: just below the lower trendline. Stop loss on sells: just above the upper trendline.
When price breaks out of a channel — especially on strong momentum — this often signals an acceleration of the trend. An ascending channel breakout to the upside can lead to a rapid, sharp move higher. Conversely, a break below the lower line of an ascending channel is a warning that the trend may be reversing. Apply the same breakout and retest principles from Module 3.
A channel forms when two parallel trendlines contain price — one acting as support, the other as resistance. Ascending channels slope upward; descending channels slope downward. Trade bounces between the two lines: buy the lower trendline, target the upper; sell the upper trendline, target the lower. Apply the same confirmation rules as regular trendline trades.
- Channel = two parallel trendlines containing price action
- Lower trendline = support / upper trendline = resistance
- Buy at lower trendline → TP at upper trendline (with confirmation)
- Sell at upper trendline → TP at lower trendline (with confirmation)
- Channel breakout = potential acceleration — apply break-and-retest rules
Quick Quiz
1. What defines a trendline channel?
2. In an ascending channel, where should you ideally place your Take Profit when buying the lower trendline?
3. How do you draw the upper trendline (resistance) of an ascending channel?
Multi-Timeframe Trendlines
⏱ 7 min readOne of the most powerful — and most overlooked — aspects of trendline trading is recognising that not all trendlines are created equal. A trendline on a weekly chart represents months or years of price behaviour and carries enormous weight. A trendline on a 15-minute chart represents a few hours and carries far less. Learning to use multiple timeframes together takes your trendline trading from amateur to professional.
The Trendline Timeframe Hierarchy
| Timeframe | Trendline Strength | Bounce Significance | Break Significance |
|---|---|---|---|
| Weekly / Monthly | Extremely strong | Major — can produce multi-week moves | Potentially marks a long-term trend change |
| Daily | Very strong | Significant — typically multi-day moves | Worth monitoring closely for reversal |
| 4-Hour | Moderate–strong | Good for swing trades | Relevant for medium-term direction |
| 1-Hour | Moderate | Good for intraday trades | Valid but context-dependent |
| 15-Minute and below | Weak | Short-term noise — treat with caution | Often not significant in larger context |
The Top-Down Approach
Professional trendline traders always work top-down — starting from the highest timeframe and zooming in for entries. Here is the process:
- Weekly/Daily chart: Identify the dominant trend and draw the primary trendline. This is your "compass" — it tells you the overall direction you should be trading.
- 4-Hour chart: Within the context set by the daily, identify secondary trendlines and key structural levels. Confirm the direction aligns with the daily view.
- 1-Hour chart: This is where you look for entries. Draw any relevant hourly trendlines, and look for the confirmation candles discussed in Module 2.
- 15-Minute chart (optional): For scalpers or those who want very precise entries, you can use the 15-minute chart to fine-tune entry timing — but always within the context set by the higher timeframes.
The single most powerful trendline trade occurs when multiple timeframes align simultaneously. A daily trendline and a 4-hour trendline converging at the same price level creates a zone of confluence that price is highly likely to respect. When you enter on the 1-hour confirmation within this zone, your trade has the backing of three timeframes. These are the setups you should be patiently waiting for.
Common Multi-Timeframe Mistakes
- Trading counter-trend on the lower timeframe: If the daily chart is in a clear downtrend, avoid buying lower-timeframe bounces — you're fighting the larger trend.
- Ignoring the bigger picture entirely: Only watching the 15-minute chart means you have no idea if you're trading in the direction of a powerful weekly trendline resistance that will crush your trade.
- Waiting for all timeframes to align perfectly: Perfect alignment is rare. You want the higher timeframes pointing in your direction — but you don't need every single timeframe to agree.
Higher timeframe trendlines carry far more weight than lower timeframe ones. Always work top-down: establish trend direction on the weekly/daily, identify key levels on the 4-hour, and enter on the 1-hour. The most powerful trades occur when trendlines from multiple timeframes converge at the same price — creating a multi-timeframe zone of confluence.
- Weekly trendline >> Daily trendline >> 4H trendline >> 1H trendline
- Top-down approach: weekly/daily for direction → 4H for structure → 1H for entries
- Multi-timeframe confluence = highest-probability trendline setups
- Never trade against a strong higher timeframe trendline
- Lower timeframe trendlines are noise within higher timeframe context
Quick Quiz
1. In the top-down approach to trendline trading, what does the weekly/daily chart tell you?
2. What is multi-timeframe confluence, and why is it valuable?
3. If the daily chart shows a clear downtrend, what should you generally avoid doing on the 1-hour chart?
Combining with Other Strategies
⏱ 8 min readA trendline on its own is a solid tool. A trendline combined with other high-probability technical concepts becomes exceptional. The principle is simple: the more factors that agree at a given price level, the more likely price is to react there. This is called confluence, and it's the cornerstone of sophisticated technical trading.
Combination 1: Trendline + Support & Resistance
This is the most straightforward and powerful combination. When a diagonal trendline coincides with a horizontal support or resistance level, the resulting area of confluence is significantly stronger than either level alone.
- How to use it: Look for cases where an ascending trendline passes through or near a known horizontal support level. The overlap creates a "support zone" — the more factors overlapping, the wider the zone, but the stronger the reaction when price enters it.
- Entry signal: A confirmation candle (pin bar or engulfing) within this zone, particularly if it also aligns with a previous key high or low.
- Why it works: Two independent groups of traders are defending the same area — those using trendlines and those using horizontal S&R. Combined demand at the zone makes bounces more reliable and more powerful.
Combination 2: Trendline + Fair Value Gap (FVG)
A Fair Value Gap (FVG) is an area of price imbalance — a zone left behind when price moves so aggressively that the market didn't get a chance to trade at those levels properly. When an ascending trendline passes through an unmitigated FVG, price is often drawn to that zone on a pullback with unusual precision.
- The setup: Identify an FVG left behind on the way up in an uptrend. Wait for price to pull back towards the trendline AND the FVG simultaneously.
- Why it's powerful: The FVG provides a precise price target for the pullback, and the trendline confirms the broader trend direction. When price enters the FVG at the trendline, enter with confirmation.
- Caveat: FVGs should be studied properly before using this combination — see the relevant strategy module for FVGs for full detail.
Combination 3: Trendline + Kill Zone Timing
Kill zones are specific windows of time when institutional traders are most active — the London open (7–10 AM GMT), the New York open (1–4 PM GMT), and the London-New York overlap (1–4 PM GMT). These sessions produce the most reliable price movements.
- The setup: You have a valid trendline. Price is pulling back towards it. The pullback coincides with or arrives at the trendline during a kill zone window.
- Why it matters: Institutional traders entering the market during kill zones add enormous volume and direction to price movements. A trendline bounce during a kill zone has the backing of institutional flow — the most powerful and reliable combination in trendline trading.
- Practical use: Set alerts for your trendline price levels. When price approaches during a kill zone, be ready at your chart and wait for the confirmation candle.
The Confluence Scoring System
A useful mental framework: score your setups before taking them.
| Confluence Factor | Score |
|---|---|
| Valid trendline (3+ touches) | +1 |
| Horizontal S&R coincides with trendline | +1 |
| FVG overlaps with trendline zone | +1 |
| Kill zone timing | +1 |
| Multi-timeframe alignment (daily + 4H agree) | +1 |
| Strong confirmation candle (pin bar / engulfing) | +1 |
| Recommended minimum to trade | 3+ |
A score of 5 or 6 represents a genuinely elite setup — the kind you should be sizing up on (within risk limits). A score of 1–2 represents a borderline setup that you might prefer to sit out.
Using a confluence scoring system naturally filters out lower-quality setups. Most professional traders only take a handful of high-confluence trades per week. The temptation is always to trade more — but the evidence clearly shows that fewer, higher-quality trades produce better results than many lower-quality ones. Patience is genuinely a competitive edge.
Trendlines become far more powerful when combined with other technical factors. The three most effective combinations are: trendline + horizontal S&R, trendline + FVG, and trendline + kill zone timing. Use a confluence scoring system to objectively rate setups — only trade those scoring 3 or more. Aim for 5+ on your highest-confidence trades.
- Confluence = multiple independent technical factors agreeing at the same level
- Combo 1: Trendline + S&R → double the demand/supply at one zone
- Combo 2: Trendline + FVG → price is drawn precisely to the trendline zone
- Combo 3: Trendline + kill zone → institutional volume backs the bounce
- Confluence scoring: trade only setups scoring 3+; aim for 5+ on best trades
Quick Quiz
1. What is "confluence" in the context of trendline trading?
2. Why is a trendline bounce during a kill zone considered particularly powerful?
3. Using the confluence scoring system, what is the minimum recommended score to take a trendline trade?
4. How does combining a trendline with a horizontal S&R level improve the setup?
Trendline Strategy — Complete!
You've mastered the full Trendline Trading Strategy course. From drawing valid trendlines to trading breaks, retests, channels, and high-confluence setups — you now have a complete trendline toolkit. Time to put it into practice on the charts.