Foundations of Support & Resistance
Before you can trade S&R, you need to understand what it actually is and how to find it on a chart. These four lessons cover the core concepts every trader must master.
What is Support?
⏱ 6 min readSupport is one of the most important concepts in all of technical analysis. Understanding it deeply — not just the definition, but the why behind it — will transform the way you read charts.
The Definition
A support level is a price area where buying pressure exceeds selling pressure. When price falls to this level, buyers step in aggressively — they believe the asset is undervalued at that price — and their buying halts the decline and pushes price back up.
You'll often see price "bounce" off support. This isn't magic or coincidence — it happens because large numbers of buyers have placed orders at or near that level, creating a wall of demand that sellers cannot push through.
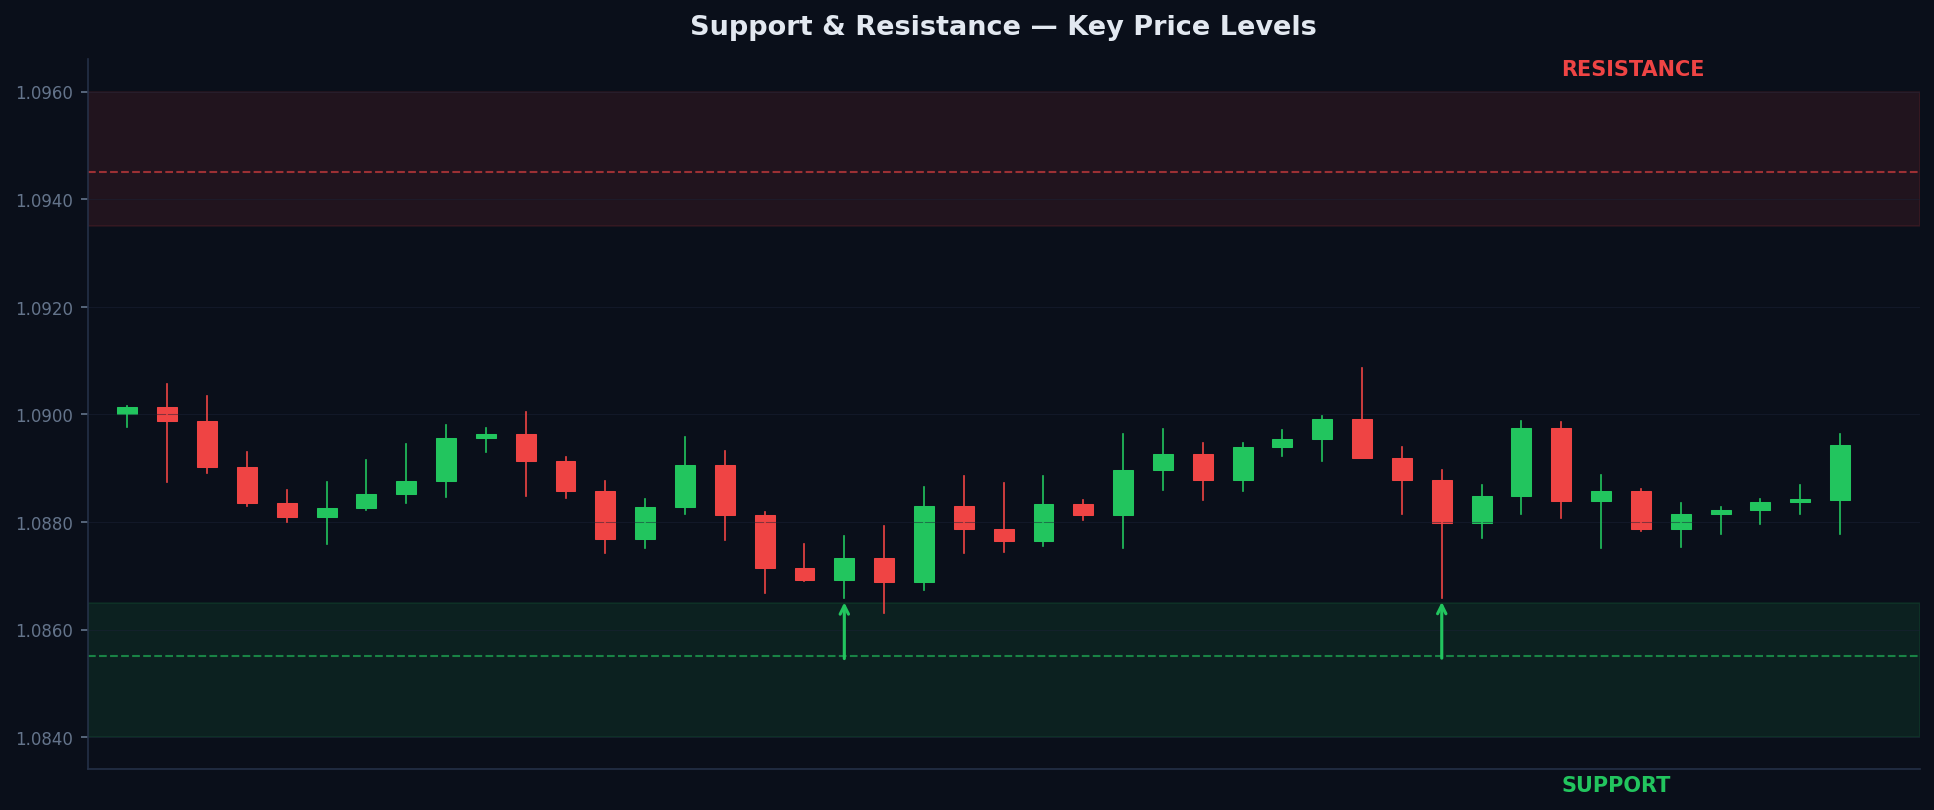
Price repeatedly bounces off the support zone — each touch confirms the level's strength
Why Does Support Form?
Support doesn't appear randomly. It forms at price levels that are psychologically or structurally significant:
- Previous lows: If price fell to 1.0800 last month and bounced strongly, buyers remember that level. When price returns, they buy again at the same level.
- Round numbers: Prices ending in .0000, .0500, or .1000 attract massive order clusters from banks and institutions.
- Areas of consolidation: When price spends a long time moving sideways, it creates a value zone. Both buyers and sellers agree on that price range, making it a natural support later.
- Prior resistance turned support: Once a level is broken, old resistance often becomes new support (more on this in Module 3).
- Support Level
- A price area where buying demand is strong enough to pause or reverse a downward move
- Bounce
- When price reaches support and reverses upward, as buyers overwhelm sellers at that level
- Price Memory
- The tendency for markets to react to previously significant price levels — because the same traders are watching the same levels
- Demand Zone
- Another term for support — a zone where buyers are concentrated and willing to buy aggressively
How Strong is the Support?
Not all support levels are equal. The strength of a support level depends on several factors:
- Number of touches: The more times price has bounced from the same level, the stronger it is. Three bounces is more convincing than one.
- Timeframe: Support on a daily chart carries more weight than support on a 15-minute chart.
- Strength of the bounce: A strong, fast rejection from support shows aggressive buyers. A slow, grinding reversal suggests weaker demand.
- How long ago: Recent support levels are generally more relevant than levels from years ago, though very significant historical levels can still matter.
Large institutions (banks, hedge funds) often place enormous buy orders at specific levels. When you see price bounce from support, you're often watching a large institution's order being filled. They want to buy at a specific price — and they have enough capital to stop price in its tracks.
Support is a price area where buyers dominate sellers, causing price to bounce upward. It forms at previous lows, round numbers, and consolidation zones. The more times price bounces from a level, the more significant that level becomes.
- Support = price floor where buying exceeds selling
- Buyers defend support because they see value at that level
- More bounces = stronger support
- Daily support > H4 support > H1 support
- Round numbers and previous lows are natural support areas
Quick Quiz
1. What does a support level represent?
2. Which of the following makes a support level STRONGER?
3. Why do round numbers (e.g. 1.1000, 1.0500) often act as support?
4. Which timeframe's support level carries the most weight?
What is Resistance?
⏱ 6 min readIf support is the floor, resistance is the ceiling. It's the other side of the same coin — and understanding both is essential to reading any chart correctly.
The Definition
A resistance level is a price area where selling pressure exceeds buying pressure. When price rises to this level, sellers believe the asset is overvalued and sell aggressively. That wave of selling prevents price from rising further and pushes it back down.
The key word here is rejection. At resistance, price gets turned away. You'll often see sharp, strong candles downward — called "bearish rejections" — as sellers hit the market with force at these levels.
Why Does Resistance Form?
Resistance forms for symmetric reasons to support:
- Previous highs: If price rallied to 1.1200 last month and then fell sharply, sellers remember. When price returns, they sell again at the same level — and traders who bought earlier are relieved to "get out even."
- Round numbers: Institutional sell orders cluster at psychological price levels, just as buy orders cluster at round-number support.
- Areas of consolidation: Extended sideways movement creates a "supply zone" — sellers who bought in that range and are now trapped will sell to exit when price returns.
- Prior support turned resistance: Broken support often becomes new resistance. Once the floor caves in, it becomes a new ceiling.
- Resistance Level
- A price area where selling pressure is strong enough to pause or reverse an upward move
- Rejection
- When price reaches resistance and reverses downward, as sellers overwhelm buyers at that level
- Supply Zone
- Another term for resistance — a zone where sellers are concentrated and willing to sell aggressively
- Trapped Traders
- Buyers who purchased at or near resistance and are now at a loss — they sell when price returns, adding to selling pressure
Reading Resistance Candles
The candlesticks that form at resistance tell you a lot about the strength of the rejection:
- Long upper wick: Price tried to push higher but was aggressively rejected. Sellers are very strong at this level.
- Bearish engulfing candle: A large red candle that completely "engulfs" the previous green candle. Strong momentum shift from buyers to sellers.
- Doji or spinning top: Indecision at resistance — buyers and sellers are evenly matched. The next candle will tell you who wins.
Imagine you bought EUR/USD at 1.1200 last month, expecting a breakout. Instead, price reversed and fell to 1.1050. You've been holding a losing trade for weeks. When price finally returns to 1.1200, your first instinct is to close the trade — "finally back to break-even!" This mass exit of trapped buyers creates additional selling pressure at resistance.
Resistance is a price ceiling where sellers dominate buyers, pushing price back down. It forms at previous highs, round numbers, and old consolidation zones. Strong rejection candles (long upper wicks, bearish engulfing) confirm the level's power. Trapped traders add extra selling pressure when price returns to resistance.
- Resistance = price ceiling where selling exceeds buying
- Sellers reject price because they consider it overvalued
- Trapped traders amplify selling at resistance
- Long upper wick = strong rejection signal
- Bearish engulfing at resistance = powerful sell signal
Quick Quiz
1. What does a resistance level represent?
2. What does a long upper wick at resistance signal?
3. Why do "trapped traders" add selling pressure at resistance?
How to Identify Key Levels
⏱ 8 min readKnowing what support and resistance are is one thing. Knowing how to find them on a live chart is the skill that separates profitable traders from those who struggle. This lesson gives you a systematic approach.
Step 1: Start on the Higher Timeframe
Always begin your analysis on the daily or 4-hour chart. Levels on higher timeframes carry more weight — they're visible to more traders, more institutions have orders there, and they hold for longer periods. Only after identifying key HTF levels should you zoom into lower timeframes for entry.
Step 2: Look for Multiple Bounces
A single touch at a price level doesn't make it significant. You're looking for at least two or three clear reactions at the same price area. Each time price touches and reacts, the level proves itself. A level that's been tested four times is far more powerful than one tested twice.
Think of support like a physical floor being tested by a wrecking ball. The first hit might not crack it. The second hit might chip it. By the third or fourth hit, it's either going to hold firm (confirming a very strong floor) or finally give way (a confirmed breakout). More tests = more significance, until it breaks.
Step 3: Mark Previous Highs and Lows
The most reliable S&R levels are swing highs (prominent peaks where price reversed downward) and swing lows (prominent troughs where price reversed upward). To mark these:
- Scroll back on your chart to see at least 3–6 months of history (more for daily charts)
- Identify the obvious peaks — the high points where price turned and fell significantly
- Identify the obvious troughs — the low points where price turned and rose significantly
- Draw horizontal lines (or zones) at each significant level
Step 4: Look for Round Numbers
Round numbers are powerful natural S&R points. For Forex pairs, look specifically at:
- Big round numbers: 1.1000, 1.1500, 1.2000 — major psychological levels
- Half levels: 1.1050, 1.1550 — secondary psychological levels
- Quarter levels: 1.1025, 1.1075 — less significant but still watched
Step 5: Assess the Strength of Each Level
| Factor | Stronger Level | Weaker Level |
|---|---|---|
| Number of touches | 3+ reactions | 1–2 reactions |
| Timeframe | Daily / Weekly | 15-min / 1-hour |
| Bounce strength | Strong, fast rejection | Slow, grinding reversal |
| Age | Recent (within 6 months) | Very old (years ago) |
| Round number alignment | Level near round number | No round number nearby |
Avoid Over-Drawing
One of the most common mistakes beginners make is drawing too many levels. If your chart looks like a prison with horizontal lines every 20 pips, you've gone too far. You want to identify the most significant levels — the ones that multiple traders around the world are also watching. Aim for 3–5 key levels on any given chart.
Avoid drawing levels at every minor fluctuation. If every little dip looks like "support" to you, your levels are too numerous to be useful. Only mark the levels where price showed a clear, significant reaction — the kind that would stand out even to a complete stranger looking at your chart.
Identify key levels by starting on higher timeframes, marking swing highs and lows with multiple touches, noting round numbers, and assessing strength by bounce frequency, timeframe, and reaction quality. Keep it clean — fewer, stronger levels beat a chart full of noise.
Quick Quiz
1. Which timeframe should you start on when identifying key S&R levels?
2. How many reactions at a level indicate it's significant?
3. Why is it a mistake to draw too many S&R levels?
Zones vs Lines
⏱ 5 min readThis lesson corrects one of the biggest misunderstandings beginners carry into trading: the idea that support and resistance are precise prices. They are not. They are zones.
Why Zones, Not Lines?
Markets are not machines. They're driven by millions of human beings, each placing orders at slightly different prices within a general area. A large institution might have buy orders spread from 1.0990 to 1.1010, not placed at exactly 1.1000 to the pip. This spread of orders creates a zone of reaction, not a precise line.
If you draw a single hard line and expect price to bounce from it to the exact pip, you'll be stopped out time and again as price "pierces" your line slightly before reversing. Draw a zone instead, and you'll give the trade enough room to breathe.
How Wide Should a Zone Be?
| Timeframe | Typical Zone Width | Notes |
|---|---|---|
| Daily (D1) | 20–50 pips | Wider zones; institutional-size orders |
| 4-Hour (H4) | 15–30 pips | Still significant — give plenty of room |
| 1-Hour (H1) | 10–20 pips | Moderately wide zones |
| 15-Minute (M15) | 5–15 pips | Tighter zones; less reliable |
How to Draw a Zone
- Find the area where price repeatedly reacted (the wicks and closes of the rejection candles)
- Draw the top of the zone at the highest close within the reaction area
- Draw the bottom of the zone at the lowest wick in the reaction area
- Shade the zone with a semi-transparent colour (green for support, red for resistance)
- The zone is now your decision area — not a precise entry price
When price approaches a zone, don't panic if it briefly pierces below the zone's bottom boundary. This is often a "wick hunt" — the market briefly sweeping orders below the zone before reversing. As long as the candle body stays within or above the zone, the support is likely still intact. It's when candle bodies start closing below the zone that you should be concerned.
S&R is a zone, not a precise price line. Draw rectangular zones that capture the reaction area. Zone width depends on the timeframe — wider on higher timeframes. A brief wick pierce of a zone doesn't invalidate it; watch for candle body closes outside the zone instead.
- S&R = zones, not precise price lines
- Daily zone width ≈ 20–50 pips; M15 zone ≈ 5–15 pips
- Draw zone top at highest close in the reaction area
- Draw zone bottom at lowest wick in the reaction area
- Wick pierces are normal — watch for body closes outside zone
Quick Quiz
1. Why should S&R be drawn as zones rather than precise lines?
2. On a daily chart, how wide is a typical S&R zone?
3. Price briefly wicks below your support zone but the candle closes back inside it. What should you conclude?
Trading S&R Bounces
Now that you can identify key levels, it's time to learn how to trade them. Bounce trading is one of the most consistent and widely used approaches in retail and professional trading alike.
The Bounce Setup
⏱ 7 min readA bounce setup is the core of S&R trading. The logic is simple: price approaches a known level, shows signs of rejection, and you enter in the direction of the expected bounce. Done correctly, it offers clearly defined risk and reward.
The Core Framework
Every bounce trade follows the same five-step framework:
- Identify a key level. Mark a significant support or resistance zone on the higher timeframe. It must have had at least 2–3 previous reactions to be considered reliable.
- Wait for price to approach the level. Don't rush. Be patient. Let price come to you — don't chase. A good level is worth waiting for.
- Look for a rejection candle. As price enters the zone, watch for a candlestick pattern that signals rejection: a long wick, a doji, a pin bar, or an engulfing candle in the opposite direction.
- Enter on confirmation. The rejection candle is your signal. Enter after the candle closes — or on the break of the rejection candle's high (for buys at support) or low (for sells at resistance).
- Place your stop and target. Stop loss goes beyond the zone (below support for buys, above resistance for sells). Take profit goes to the next significant S&R level in the direction of your trade.
Rejection Candle Signals to Look For
- Pin Bar / Hammer
- Long wick, small body. Showing strong rejection of a price level. One of the clearest bounce signals.
- Engulfing Candle
- A large candle that fully engulfs the previous candle's body. Shows a decisive shift in momentum.
- Doji
- Open and close at the same level. Shows complete indecision — watch for the next candle to confirm direction.
- Inside Bar
- A candle whose range is fully within the prior candle. Shows consolidation before a move — useful as a trigger.
The "Confirmation First" Rule
Never enter a trade before you see a rejection signal. The biggest mistake bounce traders make is entering the moment price touches a level — before the market has confirmed any rejection. Waiting for a rejection candle to close costs you a few pips of entry, but it dramatically reduces your probability of being stopped out by a false touch.
Always wait for the rejection candle to fully close before entering. A candle that has a long wick mid-formation might still close as a bullish engulfing candle. A wick doesn't confirm rejection until the candle is complete.
The bounce setup requires: a key level, patience for price to arrive, a rejection candle for confirmation, entry after close of the rejection candle, stop beyond the zone, and target at the next level. Never enter on a touch alone — always wait for confirmation.
Quick Quiz
1. When should you enter a bounce trade at support?
2. Which candle pattern provides the clearest bounce confirmation signal?
3. What is the minimum number of previous reactions a level should have before you trade a bounce from it?
Bullish Bounce (Support Buy)
⏱ 8 min readThe bullish bounce is a long (buy) trade taken when price approaches a support zone, shows clear rejection, and signals a move upward. It's one of the most reliable setups in technical trading when executed properly.
Step-by-Step: Bullish Bounce Entry
- Identify a clear support zone on H4 or Daily. Look for a zone with 2–3 previous bounces. Mark it clearly.
- Wait for price to drop into the zone. Patience is crucial. The approach should be a gradual move down — not a vertical crash (which may indicate a breakdown).
- Watch for rejection at the zone. Look for hammer candles, bullish pin bars, or bullish engulfing candles forming within or just below the zone's top boundary.
- Enter long after the rejection candle closes. Entry can be: (a) a market order at the close of the rejection candle, or (b) a limit order at the top of the zone, with rejection candle as confirmation.
- Set your stop loss below the zone. Place it 5–10 pips below the bottom boundary of the support zone (or below the wick of the rejection candle).
- Set your take profit at the next resistance zone. This is your target — the next level where sellers are likely to step in.
📊 Example Trade — EUR/USD Bullish Bounce
Risk Management for Bounce Trades
The bounce setup is only as good as the risk management attached to it. Follow these rules on every trade:
- Never risk more than 1–2% of your account per trade. No matter how good the setup looks, losing trades happen. Keep each loss small.
- Minimum 1:2 risk-to-reward ratio. If your stop loss is 40 pips, your take profit should be at least 80 pips. This means you can be wrong more than half the time and still be profitable.
- Never move your stop loss wider. If price keeps falling through your stop, the trade was wrong. Accept it. Do not widen your stop to avoid a loss.
- Consider partial take profit. Close half the trade at the first resistance level, then trail the stop on the remainder to let profits run.
A bullish bounce requires a clear support zone, price approaching it gradually, a rejection candle for confirmation, entry after the candle closes, stop below the zone, and target at the next resistance. Always use a minimum 1:2 risk-to-reward ratio.
Quick Quiz
1. Where should your stop loss be placed on a bullish bounce trade?
2. What is the minimum risk-to-reward ratio recommended for bounce trades?
3. If a vertical crash brings price into your support zone, why is this a red flag?
Bearish Rejection (Resistance Sell)
⏱ 7 min readThe bearish rejection is the mirror image of the bullish bounce — a short (sell) trade taken when price reaches resistance and shows clear signs of rejection. The logic is identical, just flipped.
Step-by-Step: Bearish Rejection Entry
- Identify a clear resistance zone on H4 or Daily. Mark it with at least 2–3 historical rejections — where price previously turned sharply downward.
- Wait for price to rally into the zone. Let it come to you. A steady, measured rally into resistance is the ideal approach.
- Watch for rejection signals. Look for bearish pin bars (long upper wick), bearish engulfing candles, or shooting stars forming within the resistance zone.
- Enter short after the rejection candle closes. Do not anticipate — wait for the candle to close before entering.
- Set stop loss above the zone. Place it 5–10 pips above the top boundary of the resistance zone.
- Set take profit at the next support zone. This is the level where buyers are likely to step in and push price back up.
📊 Example Trade — GBP/USD Bearish Rejection
Key Differences: Bearish vs Bullish Trade
| Element | Bullish Bounce (Buy) | Bearish Rejection (Sell) |
|---|---|---|
| Key level type | Support zone | Resistance zone |
| Price approaches from | Above (falling into support) | Below (rising into resistance) |
| Rejection candle | Bullish pin bar / hammer | Bearish pin bar / shooting star |
| Entry direction | Long (buy) | Short (sell) |
| Stop loss placement | Below support zone | Above resistance zone |
| Take profit target | Next resistance zone | Next support zone |
A bearish rejection trade is simply the bullish bounce in reverse. Identify resistance with multiple prior rejections, wait for price to rally into the zone, look for bearish rejection candles, enter short after confirmation, place stop above the zone, and target the next support level below.
Quick Quiz
1. Which candle signals a bearish rejection at resistance?
2. Where do you place your stop loss on a bearish rejection (sell) trade?
3. Where should your take profit target be on a bearish rejection trade?
Where to Place Stops and Targets
⏱ 7 min readUnderstanding where price should not go if your trade is correct — that's where your stop loss belongs. And understanding where the next obstacle is — that's your take profit. These two decisions are as important as the entry itself.
Stop Loss Placement
Your stop loss should be placed at a level that invalidates your trade idea. For S&R trades:
- Buy at support: If price closes a full candle below the support zone, support has failed. Your stop goes below the zone.
- Sell at resistance: If price closes a full candle above the resistance zone, resistance has broken. Your stop goes above the zone.
As a rule of thumb, add a small buffer (5–10 pips for Forex) to account for spread and slight overshoot. Do not place your stop inside the zone — give it room.
Take Profit Placement
Your take profit should be placed just before the next significant S&R level in the direction of your trade. Why "just before"? Because price often stalls or reverses at those levels before potentially breaking through. Getting out just before the level protects you from a reversal that might eat your profits.
- For a buy from support: TP goes just below the next resistance zone
- For a sell from resistance: TP goes just above the next support zone
Risk-to-Reward Explained
The risk-to-reward ratio (RR) is the relationship between how much you stand to lose (your stop loss) and how much you stand to gain (your take profit).
📐 RR Ratio Calculation
With a 1:2 RR, you only need to win 1 in every 3 trades to break even. This is why disciplined RR management is the single most powerful edge a trader can have.
If the next S&R level in your direction is only 15 pips away but your stop is 40 pips, the RR is 0.38:1 — a terrible trade. Skip it. Wait for a setup where the next level is far enough away to give you at least 1:2. Quality over quantity, always.
Stop loss goes beyond the zone where your trade idea is invalidated. Take profit goes just before the next significant S&R level. Always ensure a minimum 1:2 RR before taking a trade. With 1:2 RR, you only need to win 33% of trades to be profitable — the maths is on your side.
Quick Quiz
1. Where should you place your stop loss on a buy trade at support?
2. With a 1:2 RR ratio, what win rate do you need to be profitable?
3. Why should your take profit be placed "just before" the next S&R level?
Breakouts & Role Reversal
Not every level holds forever. When S&R breaks, it creates entirely new trading opportunities — and one of the most powerful concepts in trading: the role reversal.
What is a Breakout?
⏱ 7 min readSupport and resistance levels don't hold forever. Eventually, the buying or selling pressure on one side becomes overwhelming — and price breaks through. This is called a breakout, and it signals a significant shift in market dynamics.
A resistance breakout — note the strong momentum candle through the zone, followed by the classic retest
What Does a Real Breakout Look Like?
A genuine breakout has these characteristics:
- Strong momentum: The breakout candle is large and decisive — not a slow, grinding move. Momentum should be clear and committed.
- High volume (if available): On instruments where volume data is accessible, a real breakout is accompanied by above-average volume. This shows genuine participation.
- Candle body close beyond the zone: Not just a wick pierce — the candle body should close clearly beyond the S&R zone. This is critical.
- Follow-through: The next few candles continue in the breakout direction, confirming momentum.
False Breakouts (Fakeouts)
Not every breach of an S&R level is a genuine breakout. False breakouts (also called fakeouts) are extremely common and catch many traders off guard. A false breakout occurs when price pierces beyond an S&R level but then quickly reverses back through it.
False breakouts are actually used deliberately by large institutions as "liquidity grabs" — they push price just beyond a key level to trigger stop losses placed there by retail traders, then reverse in the opposite direction.
- Only a wick pierces the level — candle body stays within the zone
- The breakout candle is small or has a long wick back
- Price immediately reverses after the break
- No follow-through on subsequent candles
A real breakout requires a strong momentum candle with body close beyond the zone, followed by continuation candles. False breakouts are common — wait for a candle body close beyond the zone (not just a wick) before considering a breakout valid. When in doubt, wait for the retest (covered in Lesson 3.3).
Quick Quiz
1. What confirms a genuine breakout above resistance?
2. What is a "false breakout" (fakeout)?
3. Why do institutions sometimes engineer false breakouts?
The Role Reversal
⏱ 8 min readThe role reversal is arguably the single most powerful concept in all of S&R trading. Once you truly understand it, your chart analysis will transform overnight.
Why Does Role Reversal Happen?
The mechanism is rooted in trader psychology. Imagine support at 1.0800 breaks. Traders who were long (bought) from that support are now in losing trades. They are motivated by one thing: getting back to break-even. When price eventually rallies back to 1.0800, those trapped longs exit their trades — adding selling pressure at exactly 1.0800. Old support is now resistance.
The same logic applies in reverse for resistance turning to support.
- Support → Resistance
- When support breaks, trapped longs exit when price returns, creating selling pressure — turning the old floor into a new ceiling
- Resistance → Support
- When resistance breaks, traders who missed the breakout buy on the retest, and trapped shorts cover their losses — creating buying pressure at the old ceiling
- Confirmation
- For role reversal to be valid, price should return to the level and show a clear reaction (bounce). A failed retest means the level may not have reversed cleanly
- Confluence
- Role reversal levels are often the strongest setups because multiple forces align at once: old memory, trapped traders, and new order flow all pointing in the same direction
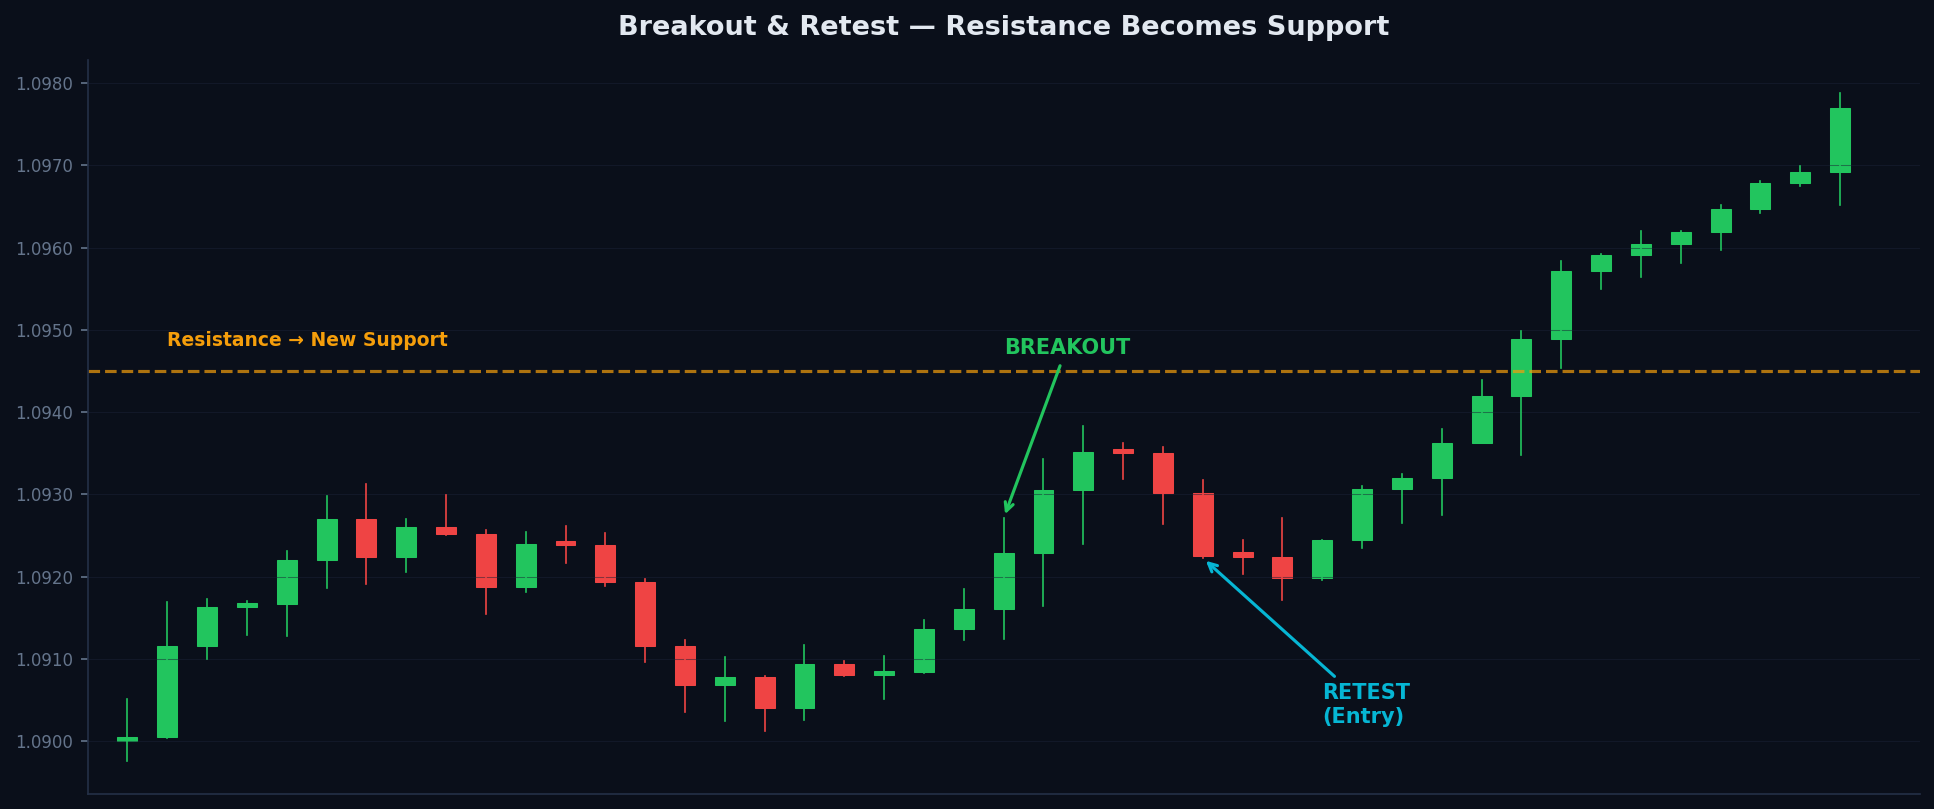
A Resistance Breakout — Role Reversal in Action
- Price has been ranging below resistance at 1.1200 — the level has rejected price 3 times.
- A large bullish candle breaks through 1.1200 with momentum. Price closes at 1.1235.
- Over the next few days, price continues higher, reaching 1.1320.
- Price then pulls back, falling down toward 1.1200 — the old resistance.
- At 1.1200, buying comes in — traders who missed the breakout buy here, and shorts from the breakout candle cover their losses. Old resistance is now support.
- Price bounces strongly from 1.1200 and resumes its upward move.
A resistance level that held for months and was tested five times will — when broken — become an extremely powerful support. The same traders who watched it reject five times now see it as a buying opportunity. The level is imprinted on the market's memory.
When S&R breaks, it flips roles: old resistance becomes new support, and vice versa. This happens because of trapped traders, new order flow, and market memory. Role reversal levels are among the most powerful setups in S&R trading — they combine historical significance with fresh motivation.
Quick Quiz
1. When a support level breaks to the downside, what does it typically become?
2. Why do "trapped longs" create selling pressure at an old support level that has broken?
3. What makes a role reversal level particularly powerful?
Trading the Retest
⏱ 8 min readThe retest is the safest and most reliable way to trade breakouts. Rather than chasing the initial break — which is risky and often too late — you wait for price to come back to the broken level and trade the role reversal from a position of confirmed strength.
The Retest Setup
- Identify the breakout. A strong momentum candle closing clearly beyond an S&R zone. This is your trigger to set an alert — not to enter.
- Wait for the pullback. After the breakout, price often pulls back toward the broken level. This is normal and healthy — not a sign the breakout has failed. Be patient.
- Watch for confirmation at the retest. When price returns to the old level (now acting in its new role), look for a rejection candle confirming the role reversal. This is your entry signal.
- Enter in the direction of the breakout. If resistance broke upward and price is retesting the old resistance as new support, enter long.
- Stop below the retest zone, target at the next level. Same rules as a standard bounce trade.
What If There's No Retest?
Sometimes, after a breakout, price doesn't return to the broken level. It just keeps going. This is frustrating but common. The professional response is simple: if there's no retest, there's no trade. Do not chase. Move on and wait for the next setup. There will always be another opportunity.
Entering immediately after a big breakout candle is one of the costliest mistakes in trading. By the time you see the candle and enter, you're often buying/selling at the worst possible price — just before the pullback. Wait for the retest. Missing a trade is far better than being caught in the pullback.
📊 Retest Trade Example — USD/JPY
Trade the retest, not the initial break. Wait for the breakout → wait for the pullback to the broken level → look for confirmation at the retest → enter in the direction of the breakout. If no retest occurs, skip the trade. Patience is the edge here.
Quick Quiz
1. What is a "retest" in the context of a breakout?
2. Why is trading the retest safer than chasing the initial breakout?
3. What should you do if price breaks out but never retests the broken level?
Advanced S&R Concepts
Take your S&R analysis to the next level with multi-timeframe confluence, psychological levels, and the most common mistakes to avoid.
S&R on Multiple Timeframes
⏱ 9 min readOne of the most powerful upgrades to your S&R analysis is adding a multi-timeframe (MTF) perspective. The same asset looks different at different scales — and the key levels on higher timeframes carry significantly more weight than those on lower ones.
The Hierarchy of Timeframes
In multi-timeframe S&R analysis, higher timeframes always override lower ones:
| Timeframe | Weight | Use For |
|---|---|---|
| Weekly (W1) | ⭐⭐⭐⭐⭐ Highest | Identifying macro key levels; rare but powerful zones |
| Daily (D1) | ⭐⭐⭐⭐ Very High | Key S&R zones for swing trading; never ignore |
| 4-Hour (H4) | ⭐⭐⭐ High | Secondary zones; refine daily levels; swing entries |
| 1-Hour (H1) | ⭐⭐ Medium | Intraday levels; entry refinement for day trades |
| 15-Min (M15) | ⭐ Lower | Precise entry timing; always check HTF first |
The Top-Down Analysis Process
- Start on the Daily chart. Identify the 3–5 most significant S&R zones. Mark them clearly. These are your primary levels.
- Drop to H4. Look for S&R levels that align with or refine your daily zones. Are there additional significant levels? Do H4 zones cluster near daily levels (confluence)?
- Drop to H1 (or M15). Only for entry refinement. Find the specific rejection candle and entry price within the higher timeframe zone.
Confluence: When Levels Stack
Confluence occurs when multiple factors point to the same price level. The most powerful S&R setups in trading have confluence — for example:
- Daily support zone + H4 support zone at the same price
- S&R zone + round number (e.g., 1.1000)
- Role reversal level + round number + previous swing high
- S&R zone + moving average (50 EMA, 200 EMA) alignment
A level with three or more confluences is significantly more likely to hold than a level with just one. Always seek confluence when looking for your best setups.
Never trade a 15-minute S&R bounce if it goes directly against a daily S&R level in the opposite direction. If the daily chart says "resistance here — sellers are strong," a 15-minute support bounce is fighting against a much bigger force. Pick fights you can win.
Always start your S&R analysis on higher timeframes (Daily first) and work down. Daily S&R overrides H1 S&R. Seek confluence — levels where multiple timeframes and other factors align. Never trade lower timeframe levels against a higher timeframe opposing level.
Quick Quiz
1. In multi-timeframe analysis, which timeframe's S&R levels carry the most weight?
2. What is "confluence" in the context of S&R analysis?
3. You see a strong support on the M15 chart, but the daily chart shows a major resistance zone at the same level. What should you do?
Psychological Levels (Round Numbers)
⏱ 7 min readPsychological levels are one of the most consistently reliable sources of S&R in the markets. They don't require technical drawing — they exist simply because human beings think in round numbers.
What Are Psychological Levels?
Psychological levels are round-number prices that attract significant order flow because of their intuitive appeal to traders, banks, and institutions. For Forex pairs, these are:
- Big Figure (Full Level)
- e.g. 1.1000, 1.2000, 1.3000. The most powerful psychological levels — major clusters of institutional orders and retail stops
- Half Level
- e.g. 1.1050, 1.1550. Secondary psychological levels — less powerful than big figures but still widely watched
- Quarter Level
- e.g. 1.1025, 1.1075. Minor levels — useful for take profit refinement but less reliable as primary S&R
Why Do They Work?
The power of psychological levels comes from several overlapping forces:
- Banks and institutions place large orders there. Treasury desks at major banks often execute large currency conversions at round numbers — it simplifies accounting and reduces complexity.
- Retail traders place stops there. "I'll set my stop at 1.1000" — millions of traders think this way. That clustering of stops creates a pool of liquidity.
- Options expirations cluster at strikes. In the Forex options market, major option strikes are almost always at round numbers. This creates "magnetic" effect on price as expiration approaches.
- Psychological comfort. Human beings naturally anchor to clean numbers. "I want to buy EUR at 1.10" is a more natural thought than "I want to buy at 1.1037."
Trading Psychological Levels
You trade psychological levels exactly as you would any other S&R zone — with one added advantage: they're predictable. You know in advance that 1.1000 will be significant before price even approaches it. This allows you to pre-plan your setups, set alerts, and be fully prepared when price arrives.
Zoom out on your chart and draw horizontal lines at every major round number within the current trading range. Immediately you'll see that many historical S&R zones align with or cluster near these levels. This is not coincidence — it's the market's natural tendency to organise itself around clean numbers.
- EUR/USD: 1.0500, 1.0700, 1.0800, 1.0900, 1.1000, 1.1200, 1.1500
- GBP/USD: 1.2000, 1.2200, 1.2500, 1.2700, 1.3000
- USD/JPY: 145.00, 148.00, 150.00, 152.00, 155.00
- USD/CAD: 1.3000, 1.3200, 1.3500, 1.3800
Psychological levels (round numbers) create powerful S&R because banks, institutions, retail traders, and options markets all converge at these prices. Mark them in advance on your charts. When a psychological level aligns with a technical S&R zone, the combination creates one of the strongest setups available.
Quick Quiz
1. Why is 1.1000 on EUR/USD likely to be a significant S&R level?
2. Which is the most powerful type of psychological level?
3. What advantage do psychological levels give you over purely technical S&R?
Common Mistakes with S&R
⏱ 8 min readKnowing what to do is half the battle. Knowing what not to do is the other half — and arguably more important for your account's survival. This lesson covers the most common S&R mistakes and how to avoid them.
Mistake 1: Drawing Too Many Levels
The most widespread beginner mistake. If your chart has 15 horizontal lines on it, your analysis is useless. You're seeing a "level" everywhere, which means price is always near a level — and therefore the concept has lost its meaning.
Fix: Limit yourself to 3–5 key levels per chart. If you've drawn more, ask yourself: "Would a professional trader also see this as significant?" If the answer is uncertain, delete it.
Mistake 2: Trading Against the Trend at Weak Levels
Just because there's support on a downtrending chart doesn't mean you should buy it. When the overall trend is strongly downward, support levels get broken one by one. Buying every support bounce in a downtrend is fighting the most powerful force in markets: momentum.
Fix: Always check the higher timeframe trend first. In a downtrend, look for short (sell) setups at resistance, not long (buy) setups at support. Trade with the trend, not against it.
Mistake 3: Not Waiting for Confirmation
Entering the moment price touches a level — without any rejection signal — is gambling, not trading. The level might be tested and broken without any bounce. You'll be caught on the wrong side of a breakout.
Fix: Always wait for a rejection candle to close before entering. Patience separates profitable traders from impatient ones.
Mistake 4: Ignoring Timeframe Context
Trading a 15-minute support bounce when the daily chart shows a major resistance zone just above your entry is a recipe for a losing trade. The higher timeframe is always working against you in this scenario.
Fix: Always perform top-down analysis. Before entering any trade, check the daily chart and ask: "Is there a significant opposing S&R level close to where I'm entering?" If yes, either skip the trade or significantly reduce your target.
Mistake 5: Treating Every Bounce as a Trade
Not every touch of an S&R level is a tradeable setup. Markets are messy. Sometimes a level is touched with very weak follow-through. Sometimes the risk-to-reward ratio is terrible because the next level is only 15 pips away. Sometimes the candle signals are ambiguous.
Fix: Apply a quality filter. Your best trades will have: (1) a strong level with multiple touches, (2) a clear rejection candle, (3) minimum 1:2 RR, and (4) alignment with higher timeframe direction. If any element is missing, skip it.
Beginners often feel they need to be in a trade at all times. This leads to trading weak levels, accepting poor RR, and ignoring conflicting signals — all in the name of "having a position." Professional traders might only take 2–3 high-quality setups per week. Quality, not quantity. One excellent trade beats ten mediocre ones.
The five most common S&R mistakes are: drawing too many levels, trading against the trend at weak levels, entering without confirmation, ignoring higher timeframe context, and treating every level as a trade. Fix each one: be selective, follow the trend, wait for confirmation, check the daily chart first, and apply a quality filter to every setup.
Final Quiz — Module 4
1. How many key S&R levels should you aim to have on a clean chart?
2. The daily chart is in a strong downtrend. What should you primarily look to trade?
3. What is the "quality filter" for an S&R setup?
4. Why do professional traders only take 2–3 high-quality setups per week?
Course Complete!
You've completed the Support & Resistance Strategy course. You now understand how to identify key levels, trade bounces and rejections, spot breakouts, apply the role reversal concept, and use multi-timeframe confluence. You're ready to apply this on live charts.