Understanding Fair Value Gaps (FVGs)
⏱ 8 min readA Fair Value Gap (FVG) is one of the most important concepts in modern institutional trading. Before you can grasp what makes one "inverse," you need to understand what an FVG actually is and why it appears on a chart.
An overview of the FVG structure — three candles creating a price imbalance that the market seeks to fill
The Three-Candle Pattern
An FVG is defined by a specific three-candle sequence. The rules are precise:
- Candle 1
- The first candle in the sequence. Its high (for a bullish FVG) or low (for a bearish FVG) is the starting reference point.
- Candle 2
- The "gap" candle. This is usually a large, aggressive candle — the one that drives price away sharply, leaving a void behind it.
- Candle 3
- The candle that confirms the gap. Its low (for a bullish FVG) or high (for a bearish FVG) does not overlap with Candle 1.
- The Gap Zone
- The empty space between Candle 1's extreme and Candle 3's extreme. This is the price range that was never properly traded — the imbalance.
The critical condition: the high of Candle 1 and the low of Candle 3 do not overlap. If there is any overlap, there is no FVG — the market traded through that range and balance exists there.
Why Does the Market Fill FVGs?
Markets are driven by efficiency. Institutional algorithms are constantly working to balance supply and demand. When an FVG forms, there is a pocket of prices where very little or no real two-way trading occurred. Smart money tends to seek out these inefficiencies and fill them — either as part of normal price discovery or as a deliberate draw on liquidity.
This is not a guaranteed rule — not every FVG gets filled. But statistically, and in the context of a structured trading plan, FVGs are highly reliable reference points for where price may return.
Identifying an FVG on a Chart
Once you know what to look for, FVGs become visually obvious. Here is your step-by-step identification process:
Look for a large-bodied candle that moved significantly in one direction. This is usually the easiest to spot.
Note its high (for a bullish move) or its low (for a bearish move).
Note its low (for a bullish move) or its high (for a bearish move).
If Candle 1's high is below Candle 3's low (bullish), or Candle 1's low is above Candle 3's high (bearish), you have a valid FVG.
Not all gaps on a chart are FVGs. A weekend gap (when markets reopen after closure) or a news-driven spike gap is different. A true FVG is formed within normal market structure, typically during institutional activity in a liquid session such as the London or New York open.
A Fair Value Gap is a three-candle pattern where Candle 1's high and Candle 3's low (or vice versa) do not overlap, leaving a zone of price that was never properly traded. The market tends to return and fill this gap due to its drive toward price efficiency.
- FVG = three-candle pattern with a gap between Candle 1's extreme and Candle 3's extreme
- Candle 2 is the aggressive, large-bodied candle that creates the gap
- For a bullish FVG: Candle 1 high < Candle 3 low
- For a bearish FVG: Candle 1 low > Candle 3 high
- Markets tend to return to fill FVGs due to price efficiency
Quick Quiz
1. How many candles make up a Fair Value Gap pattern?
2. For a bullish FVG to be valid, which condition must be true?
3. Why does price tend to return to fill an FVG?
4. Which candle in the FVG sequence is typically the most aggressive and large-bodied?
Why FVGs Form
⏱ 7 min readUnderstanding why Fair Value Gaps form is just as important as knowing what they look like. When you understand the mechanics behind them, you'll trade them with far greater conviction.
Institutional Order Flow
FVGs are not random. They are the footprint of large institutional orders being executed in the market. Banks, hedge funds, and proprietary trading firms trade in sizes that retail traders cannot. When one of these institutions places a large order — say, buying 500 million dollars of a currency pair — the sheer size of that order overwhelms the available liquidity at nearby price levels.
The result? Price gets pushed through multiple levels rapidly, leaving behind a zone where almost no opposing orders existed. This is the gap. It is the direct evidence of institutional aggression.
Supply and Demand Imbalance
At its core, an FVG is a supply/demand imbalance. When a bullish FVG forms, it means buyers were so dominant that sellers simply could not match their aggression at that price range. The zone is therefore "unfair" — price moved through it without proper auction.
| FVG Type | Who Was Dominant | What Happened | Market Implication |
|---|---|---|---|
| Bullish FVG | Buyers (institutions buying) | Price moved up aggressively, skipping sell-side orders | Zone may act as support when revisited |
| Bearish FVG | Sellers (institutions selling) | Price moved down aggressively, skipping buy-side orders | Zone may act as resistance when revisited |
The Market's Drive Towards Efficiency
Financial markets operate as a two-sided auction. Every price level needs a buyer and a seller to establish fair value. When price moves through a zone so quickly that only one side is represented, the market considers that zone "inefficient."
Algorithmic systems — which account for the vast majority of market volume — are programmed to seek liquidity. Unfilled orders sitting in a gap zone represent a pool of latent liquidity. Price will often return to fill those orders, completing the auction and establishing true fair value at that level.
Session Context Matters
The strongest FVGs typically form during high-volume institutional sessions:
- London Open (08:00–10:00 GMT): The most active FVG-forming window for forex pairs. Institutional orders flood in at the open.
- New York Open (13:30–15:30 GMT): Second major window, especially for US equities, indices, and GBPUSD/EURUSD pairs.
- London–New York Overlap (13:30–17:00 GMT): Peak liquidity. FVGs formed here tend to be the most respected.
FVGs that form during the Asian session, overnight, or around thin holiday markets are far less reliable. Without institutional backing, the gap has no real reason to be respected. Always consider the session context before acting on an FVG.
FVGs form because institutional order flow is too large for the available opposing liquidity, creating a price zone that was skipped. The market is "inefficient" at that level and is likely to return and fill the gap as part of its natural drive toward price efficiency. Session context is critical — the best FVGs form during London and New York opens.
- FVGs are created by institutional order flow overwhelming available liquidity
- Bullish FVG = buyer dominance; bearish FVG = seller dominance
- Markets return to FVGs to fill unfilled orders and restore price efficiency
- Best FVGs form during London Open, NY Open, or the overlap
- Avoid FVGs from low-liquidity sessions (Asian session, holidays)
Quick Quiz
1. What primarily causes FVGs to form in the market?
2. A bearish FVG forms when which side is dominant?
3. Which trading session typically produces the most reliable FVGs for forex pairs?
4. Why is an FVG zone considered "inefficient"?
Bullish vs Bearish FVGs
⏱ 7 min readNow that you understand what an FVG is and why it forms, it's time to differentiate between the two types. Each has its own formation rules, visual characteristics, and implications for price behaviour.
Bullish Fair Value Gap
A Bullish FVG forms during an upward price impulse. The three candles move higher aggressively, leaving a gap below the current price. Here is the precise definition:
Bullish FVG = Candle 1 High < Candle 3 Low
In a bullish market context, this zone acts as a demand area. When price pulls back into it, buyers who missed the original move step in, pushing price higher again. The gap between Candle 1's high and Candle 3's low is the zone you mark on your chart.
Bullish FVG — Visual
Three candles moving upward. A visible gap between the top of Candle 1 and the bottom of Candle 3. Candle 2 is typically a large green (bullish) candle.
What to Mark
Draw a box from Candle 1's high up to Candle 3's low. This rectangle is your bullish FVG zone.
Trend Context
Only trade bullish FVGs when the higher timeframe bias is bullish. FVGs against the main trend are far less reliable.
Bearish Fair Value Gap
A Bearish FVG forms during a downward price impulse. Price drops sharply, leaving a gap above the current price. The definition:
Bearish FVG = Candle 1 Low > Candle 3 High
In a bearish market context, this zone acts as a supply area. When price retraces up into it, sellers who missed the initial drop step in and push price lower again.
| Feature | Bullish FVG | Bearish FVG |
|---|---|---|
| Formation direction | During an upward impulse | During a downward impulse |
| Gap condition | Candle 1 High < Candle 3 Low | Candle 1 Low > Candle 3 High |
| Zone location | Below current price | Above current price |
| Acts as | Support / demand zone | Resistance / supply zone |
| Candle 2 typical colour | Green (bullish) | Red (bearish) |
| Best trade direction | Long (buy) | Short (sell) |
Valid vs Invalid FVGs
Not every gap you see on a chart is a tradeable FVG. Here's how to filter quality from noise:
- Valid: Gap forms during an active institutional session (London or New York). Candle 2 has a large body. The overall structure supports the direction.
- Invalid: Gap forms during the Asian session. All three candles are small and choppy. The gap is tiny (less than 3–5 pips on forex, depending on pair). Price is in a sideways range with no clear directional bias.
Many traders only wait for price to reach the 50% level of an FVG zone (the midpoint) before entering, rather than waiting for price to touch the full gap. The 50% level often acts as the strongest point of reaction, giving a better risk-to-reward entry.
Bullish FVGs form on upward impulses (Candle 1 high < Candle 3 low) and act as support. Bearish FVGs form on downward impulses (Candle 1 low > Candle 3 high) and act as resistance. Always trade them in the direction of the higher timeframe trend, and filter out gaps formed in low-liquidity sessions.
- Bullish FVG: forms during upward impulse, acts as support
- Bearish FVG: forms during downward impulse, acts as resistance
- Mark the zone from Candle 1's extreme to Candle 3's extreme
- The 50% midpoint of the gap is often the strongest entry level
- Only trade FVGs aligned with higher timeframe bias
Quick Quiz
1. For a bearish FVG, which condition is required?
2. How do you mark a bullish FVG zone on your chart?
3. Which of the following makes an FVG less reliable?
4. What does the 50% rule refer to in FVG trading?
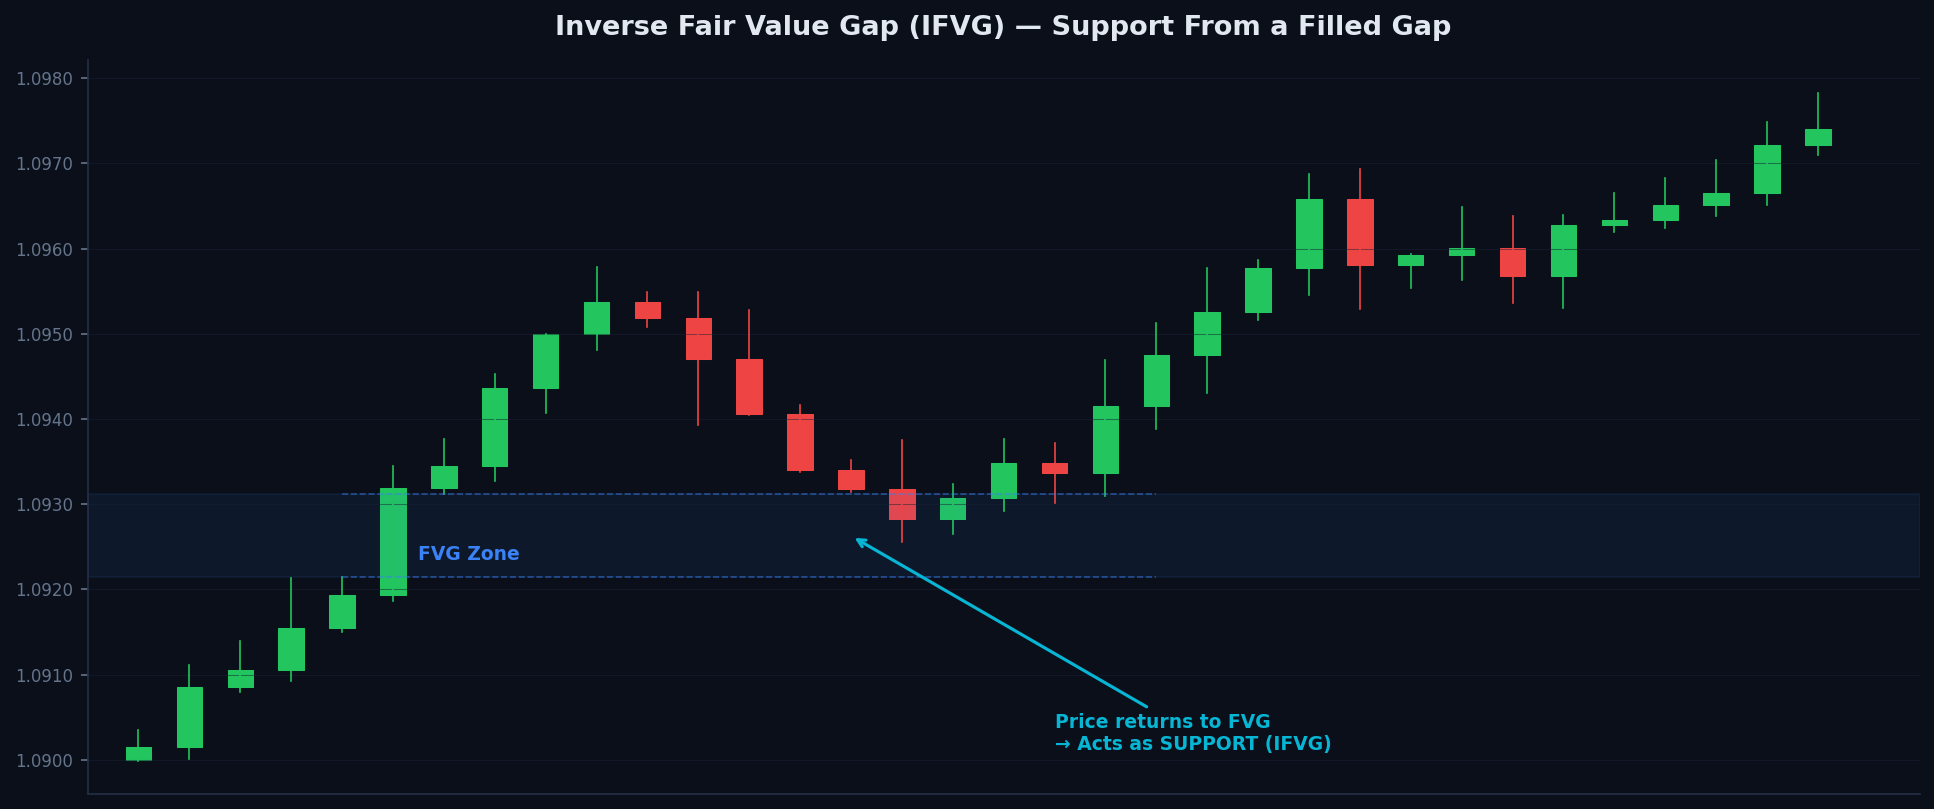
The Inversion Concept
⏱ 8 min readThe Inverse Fair Value Gap (IFVG) is the natural next step after understanding a standard FVG. The key word is inversion — a zone that once acted as one thing becomes the opposite. This is where the strategy's edge lies.
What is Inversion?
In market structure, inversion refers to the process by which a support level becomes resistance, or a resistance level becomes support. You may already know this concept from traditional technical analysis. The IFVG applies this same principle to Fair Value Gap zones.
The Inversion Process — Step by Step
Here is the exact sequence that creates an Inverse Fair Value Gap:
Price creates a standard bullish or bearish FVG. At this stage, it is simply a gap — a zone of imbalance waiting to be filled.
Price retraces into the gap zone and trades through it completely. The gap is now "consumed" — it has been filled and equilibrium has been partially restored at that level.
Because price has now traded through the gap, it has established a history of transaction at that level. The zone is no longer "untested" — it has been tested and defended. Institutions now treat it differently.
On the next visit, the former FVG now acts in the opposite role. A bullish FVG that was previously support (and has been filled) now acts as resistance. A bearish FVG that was resistance now acts as support.
Why Does Inversion Happen?
The reason price respects the inverted zone comes back to institutional order flow. When a large buyer fills an FVG with their orders, they have established a position. If price then breaks back through that level, their position is now underwater. They may use that zone as a reference to add to short positions or liquidate longs — effectively turning the former support into resistance.
Furthermore, the market has now demonstrated that the original imbalance was not strong enough to hold. The "stronger hand" won — and the inverted zone represents that shift in power.
Inversion is a context-dependent phenomenon. A filled FVG only becomes a reliable IFVG if price returns to it in a controlled, structured manner — not in a chaotic, high-volatility spike. The quality of the fill and the market structure surrounding it both matter.
An Inverse FVG is created when a standard FVG is filled and the zone subsequently flips polarity — former support becomes resistance, and former resistance becomes support. This happens because the institutional order flow that created the original gap has now been absorbed, shifting the balance of power at that price level.
- Inversion = a level that was support becomes resistance, or vice versa
- IFVG forms after a standard FVG is completely filled by price
- The filled FVG zone now acts in the opposite role on the next visit
- Inversion occurs due to institutional orders being absorbed and power shifting
- Not every filled FVG inverts — context and structure must support it
Quick Quiz
1. What must happen to an FVG before it becomes an Inverse FVG?
2. After a bullish FVG has been fully filled, it inverts and becomes...
3. Why does an inverted FVG gain significance as a future level?
4. Does every filled FVG automatically become a reliable IFVG?
Bullish IFVG Setup
⏱ 9 min readThe Bullish IFVG setup is a trade you take long (buy) when a previously bearish FVG is filled and then acts as support on a subsequent revisit. This is one of the cleanest setups in institutional trading.
The Full Sequence
Follow this sequence carefully. Every step must be present for a valid Bullish IFVG:
Price drops aggressively, creating a bearish FVG (Candle 1 low > Candle 3 high). This gap acts as a potential resistance zone.
Price retraces upward and trades through the bearish FVG zone completely. The gap is consumed — the zone has been tested.
After filling the FVG, price continues higher, forming a bullish market structure shift (higher high or Break of Structure). This confirms the inversion is in play.
Price retraces down to the former bearish FVG zone. This is now your Bullish IFVG — a zone that was previously resistance has become support.
Look for a bullish reaction at the IFVG zone — a rejection wick, a bullish candle close, or a lower timeframe confirmation. Enter your buy position.
What Confirmation to Look For
When price returns to the Bullish IFVG zone, you do not simply enter blindly. Look for at least one of the following confirmations before executing:
- Bullish rejection wick: A candle with a long lower wick off the IFVG zone, closing back inside or above it
- Engulfing candle: A large bullish candle that consumes the previous red candle's body at the IFVG zone
- Lower timeframe market structure shift: Drop to the 5M or 15M chart and look for a bullish Break of Structure (BOS) off the zone
- Bounce off the 50% level: If price reacts at the midpoint of the IFVG before reaching the full bottom, this is often a high-quality entry
If price aggressively breaks through the IFVG zone without any reaction, the setup is invalidated. A true Bullish IFVG will produce visible buying pressure when price reaches the zone. If it blows straight through, move on — do not chase the trade.
A Bullish IFVG begins with a bearish FVG that gets filled. Once filled, if price rallies away and then pulls back to the zone, that zone should now act as support. Wait for a confirmation signal at the zone before entering long — never enter blindly.
- Bullish IFVG = bearish FVG that has been filled and now acts as support
- Must see a market structure shift bullish above the zone after the fill
- Entry: long when price returns to the zone with confirmation
- Confirmations: rejection wick, engulfing candle, lower timeframe BOS
- Invalidated if price aggressively breaks through the zone without reaction
Quick Quiz
1. What type of FVG forms first in a Bullish IFVG setup?
2. After the bearish FVG is filled in a Bullish IFVG setup, what must happen next?
3. Which of these is a valid confirmation for entering a Bullish IFVG?
4. What does it mean if price aggressively breaks through the Bullish IFVG zone?
Bearish IFVG Setup
⏱ 9 min readThe Bearish IFVG is the mirror image of the Bullish IFVG. Here, you are looking to sell when a previously bullish FVG is filled and the zone subsequently acts as resistance on the next visit.
The Full Sequence
Price rallies aggressively, creating a bullish FVG (Candle 1 high < Candle 3 low). This gap sits below current price as a potential support zone.
Price retraces downward and trades through the bullish FVG zone completely. The zone is consumed.
After filling the FVG, price continues lower, confirming a bearish structural shift (lower low or Break of Structure). The inversion is confirmed.
Price pulls back up toward the former bullish FVG zone. This is now your Bearish IFVG — former support has become resistance.
Look for a bearish reaction at the zone — a rejection wick, a bearish candle close, or a lower timeframe confirmation. Enter your sell position.
Side-by-Side Comparison
| Feature | Bullish IFVG | Bearish IFVG |
|---|---|---|
| Original FVG | Bearish FVG | Bullish FVG |
| FVG fill direction | Price rallies into bearish FVG | Price drops into bullish FVG |
| Structure shift after fill | Bullish (higher high) | Bearish (lower low) |
| IFVG zone acts as | Support | Resistance |
| Trade direction | Long (buy) | Short (sell) |
| Invalidation | Zone aggressively broken to downside | Zone aggressively broken to upside |
What Confirmation to Look For
As with the bullish setup, you need confirmation before shorting from a Bearish IFVG:
- Bearish rejection wick: A candle with a long upper wick off the IFVG zone, closing back inside or below it
- Bearish engulfing: A large red candle that swallows the previous green candle's body at the zone
- Lower timeframe bearish BOS: Drop to a smaller timeframe and confirm a bearish structure shift off the IFVG zone
- Reaction at the 50% level: Again, the midpoint of the zone often provides the sharpest reaction
A Bearish IFVG setup is only worth trading if the higher timeframe (daily or 4H) is in a bearish trend. Trading a bearish IFVG against a strong uptrend will get you chopped out repeatedly. Always ensure the structure above your working timeframe supports your direction.
A Bearish IFVG begins with a bullish FVG that gets filled by a price drop. If price then continues lower (bearish structure shift) and later retraces up to the zone, that zone should act as resistance. Wait for bearish confirmation at the zone, and only take the setup if the higher timeframe bias is bearish.
- Bearish IFVG = bullish FVG that has been filled and now acts as resistance
- Must see a bearish structure shift below the zone after the fill
- Entry: short when price returns to the zone with confirmation
- Confirmations: bearish rejection wick, engulfing candle, lower timeframe BOS
- Only trade bearish IFVGs when the higher timeframe trend is bearish
Quick Quiz
1. What type of FVG forms first in a Bearish IFVG setup?
2. In the Bearish IFVG sequence, which structure shift confirms the inversion?
3. Which higher timeframe bias should support a Bearish IFVG trade?
4. Which of these is a valid confirmation for entering a Bearish IFVG?
Entry Rules
⏱ 9 min readA great setup without precise entry rules is worthless. This lesson gives you the exact rules for timing your entry on an IFVG trade — nothing vague, nothing optional.
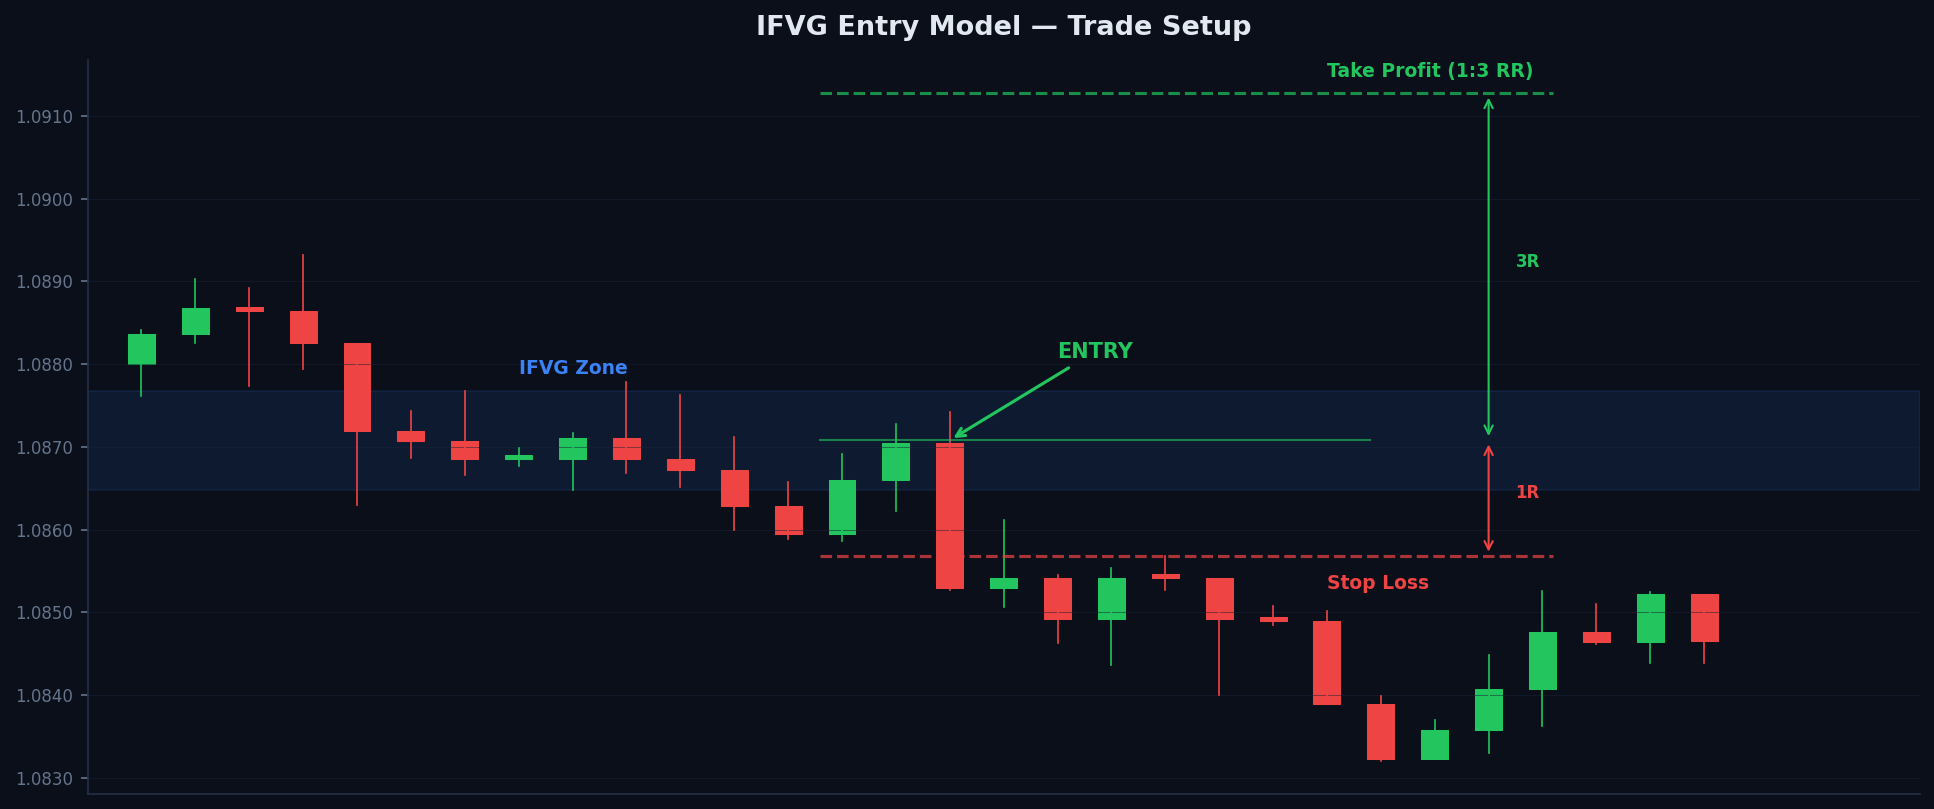
The IFVG entry model — from FVG formation through fill, structure shift, and confirmed IFVG entry
The Four-Step Entry Process
Every valid IFVG entry follows this exact sequence. Do not skip steps:
Identify a clean, institutional-quality FVG — large Candle 2, formed during a liquid session, aligned with the higher timeframe bias. Mark the zone on your chart.
Patience is critical here. Do not enter the FVG as it fills — wait for price to pass through the entire zone. A partial fill does not create a valid IFVG.
After the fill and the subsequent structure shift, wait for price to pull back to the former FVG zone. This pullback is typically structured — not a spike, but a measured retracement.
Only enter when price shows clear rejection at the IFVG zone. Use a limit order at the 50% level of the zone, or a market order on the close of a confirmation candle.
Entry Methods
There are two primary ways to execute an IFVG entry, each with its own trade-offs:
| Method | How It Works | Pros | Cons |
|---|---|---|---|
| Limit Order | Place a limit buy/sell at the 50% level or bottom/top of the IFVG zone in advance | Better entry price, less screen time needed | May trigger without proper reaction; requires trust in the level |
| Confirmation Entry | Wait for a rejection candle or lower timeframe BOS, then enter at market | Higher confidence, seeing the zone defend itself | Slightly worse entry price, potential to miss the move |
Context Checklist Before Entry
Before pressing the button, run through this checklist mentally:
- ✔ Higher timeframe trend aligns with my trade direction
- ✔ The original FVG was formed during a liquid session (London/NY)
- ✔ The FVG was completely filled — not just touched
- ✔ A structure shift confirmed the inversion
- ✔ Price has returned to the zone in a structured manner (not a spike)
- ✔ I have a confirmation signal at the zone
- ✔ I know exactly where my stop loss will go
- ✔ The risk-to-reward is at least 1:2
The most common IFVG mistake is entering as the FVG is being filled, not after. An FVG that is currently being filled may just be filling and moving on — there is no IFVG until price has moved away from the zone and returned to it. Patience is the edge.
IFVG entries follow a strict four-step process: FVG forms → FVG is filled → structure shifts → price returns to the zone and shows reaction. Use either a limit order at the 50% level or a confirmation candle entry. Never skip the context checklist before executing.
- Entry process: FVG forms → filled completely → structure shift → return to zone → react
- Two methods: limit order at 50% level, or confirmation candle entry
- Always check the context checklist before entering
- Minimum RR of 1:2 required before the trade is worth taking
- Never enter while the FVG is being filled — wait for the return visit
Quick Quiz
1. What is the correct order of the four IFVG entry steps?
2. What is the advantage of using a limit order entry at the 50% level?
3. What is the minimum risk-to-reward ratio recommended for IFVG trades?
4. Why is it wrong to enter an IFVG trade while the original FVG is being filled?
Stop Loss Placement
⏱ 7 min readThe stop loss is where your idea is proven wrong. Placing it correctly on an IFVG trade is critical — too tight and you get stopped out by normal volatility; too wide and your risk-to-reward becomes unacceptable.
The Core Principle
For an IFVG trade, your stop loss goes beyond the opposite edge of the IFVG zone. The logic is simple: if the zone was truly inverted, price should not be trading through it. A move beyond the zone tells you the inversion failed.
- Bullish IFVG — Stop Loss
- Place your stop loss below the bottom of the IFVG zone. A candle close below this level invalidates the bullish thesis.
- Bearish IFVG — Stop Loss
- Place your stop loss above the top of the IFVG zone. A candle close above this level invalidates the bearish thesis.
- Buffer
- Add a small buffer (2–5 pips for forex, or a few ticks for indices) beyond the zone edge to avoid being stopped by a wick that merely pokes through.
- Zone Width Rule
- Never risk more than the width of the IFVG zone itself. If the zone is 10 pips wide and your stop would need to be 30 pips, the setup is structurally poor.
Why Tight Stops Are Better
A key advantage of the IFVG strategy is that it can produce very tight stops relative to the target. Because the IFVG zone itself defines your invalidation level precisely, there is no guesswork. You are not using an arbitrary number of pips — you are letting the market's own structure define the risk.
With a tight stop and a clear structural target (covered in the next lesson), it is common to achieve risk-to-reward ratios of 1:3, 1:5, or even higher on quality setups. This means you can be wrong more than half the time and still be profitable.
Stop Loss Mistakes to Avoid
- Placing the stop inside the zone: The zone itself may see some wick activity. Your stop must be beyond the zone, not inside it.
- Using a round number stop: "I'll stop out at -20 pips" without reference to the zone is arbitrary and gives away the edge of having a structural level.
- Moving the stop mid-trade: Never widen your stop after entering. If the zone is holding, the stop stays where it is. If you're uncomfortable, your position size is too large.
- Forgetting the buffer: Market makers know where obvious stops are. A 2–5 pip buffer beyond the zone edge protects against stop hunts that poke just beyond the level before reversing.
Stop losses go beyond the opposite edge of the IFVG zone. For a bullish IFVG, stop below the zone; for a bearish IFVG, stop above. Add a small buffer, keep stops tight, and never risk more than the width of the zone. A tight stop is a feature, not a flaw — it enables high risk-to-reward trades.
- Bullish IFVG: stop below the bottom of the zone (+ small buffer)
- Bearish IFVG: stop above the top of the zone (+ small buffer)
- Never risk more than the width of the zone itself
- Never widen your stop mid-trade
- Tight stops = better RR; if position size is too large, reduce it
Quick Quiz
1. For a Bullish IFVG trade, where should the stop loss be placed?
2. What does the Zone Width Rule state?
3. Why is a small buffer added beyond the IFVG zone edge?
4. If you feel uncomfortable with how close your stop is, what should you do?
Take Profit Targets
⏱ 7 min readKnowing when to exit is just as important as knowing when to enter. Greedy targets get clipped; tight targets leave money on the table. This lesson gives you a structured framework for setting take profits on IFVG trades.
The Minimum: 1:2 Risk-to-Reward
Before entering any IFVG trade, confirm that a minimum 1:2 risk-to-reward ratio is available. This means for every unit of risk (from entry to stop), there must be at least two units of potential profit (from entry to the first target) available in the market structure ahead.
If the market structure does not offer 1:2 RR — because the next resistance or liquidity level is too close — the trade is not worth taking. Move on and wait for a better setup.
Where to Place Your Take Profit
Target the next significant level in the market. In order of priority:
Price is drawn to liquidity — the highs and lows where stop losses cluster. The previous swing high (for longs) or previous swing low (for shorts) is your primary target.
If there is an open bullish FVG above the current price (for longs) or an open bearish FVG below (for shorts), price is likely to be drawn into it. Use the 50% level of that FVG as your target.
A previous swing high, demand/supply zone, or key support/resistance from the higher timeframe. These tend to slow price or cause a reaction.
Partial Exits and Trade Management
A professional approach to take profits uses partial exits rather than a single all-out close:
- TP1 (50% of position): First liquidity level or 1:2 RR — take half off and move stop to break-even
- TP2 (remaining 50%): Second target (further liquidity or unfilled FVG) — let the remainder run to 1:4 or 1:5 RR
This approach locks in profit early while allowing the position to capture larger moves. Once TP1 is hit and the stop is at break-even, the trade becomes risk-free.
Many beginners target round numbers (e.g., "I'll take profit at 1.1000"). Institutional players are well aware of retail clustering at round numbers and often run price through them before reversing. Use structural levels — swing highs/lows and FVGs — not round numbers as your targets.
Target the next liquidity level (swing high/low), unfilled FVG, or structural level. Minimum 1:2 RR before entry. Use partial exits — take 50% at the first target and move your stop to break-even, then let the remainder run to a higher target. Never use round numbers as take profit levels.
- Minimum 1:2 RR required — if it's not there, skip the trade
- Primary target: next liquidity level (swing high for longs, swing low for shorts)
- Secondary target: next unfilled FVG in the trade direction
- Use partial exits: 50% at TP1 → move stop to B/E → let 50% run to TP2
- Avoid targeting round numbers — use structural levels only
Quick Quiz
1. What is the minimum risk-to-reward ratio recommended before entering an IFVG trade?
2. What is the primary take profit target for a Bullish IFVG trade?
3. After hitting TP1 and taking 50% off the trade, what should you do with the stop loss?
4. Why should you avoid using round numbers as take profit targets?
Timeframe Selection
⏱ 7 min readIFVGs work across all timeframes, but they are not all created equal. Your choice of timeframe affects the quality of your setups, the size of your stops, and the frequency of trades available to you.
The Timeframe Hierarchy
In IFVG trading, you always work with a top-down approach. Start from the highest timeframe to establish bias, and move down to find your entry. Never start from the bottom and work up — you will miss the bigger picture.
- Daily (1D) — Bias Timeframe
- Use the daily chart to determine the overall market direction. Is price making higher highs and higher lows (bullish), or lower lows and lower highs (bearish)? Only trade in this direction.
- 4H — Context Timeframe
- The 4-hour chart shows the intermediate trend and identifies major IFVGs worth watching. IFVGs from the 4H carry significant weight.
- 1H — Primary Trade Timeframe
- The 1-hour chart is where most IFVG setups are best identified and managed. The combination of detail and signal frequency makes this the ideal working timeframe.
- 15M — Entry Refinement
- Drop to the 15-minute chart to time your entry more precisely on an IFVG identified on the 1H or 4H. Sharper entries = tighter stops = better RR.
Which Timeframes Are Most Reliable?
The 15M, 1H, and 4H timeframes offer the best balance of reliability and trade frequency for the IFVG strategy. Here is why:
- 15M: Fast enough to provide frequent entries, but slow enough that noise is filtered. Kill zone timing (London/NY open) is critical here.
- 1H: The sweet spot. Gaps are large enough to be meaningful, structure shifts are clear, and intraday noise is minimal.
- 4H: High-conviction setups with fewer opportunities but larger moves. Best for swing traders.
Higher Timeframe IFVGs Carry More Weight
This is a fundamental principle: a 4H IFVG is more powerful than a 15M IFVG. The reason is simple — more capital was involved in creating the original FVG, more orders sit in the inverted zone, and more institutional players are watching that level.
When a 4H IFVG aligns with a 1H IFVG, you have a confluence of levels — a significantly higher probability setup. Use this alignment actively.
The 5-minute chart has too much noise for reliable IFVG identification. Gaps form and fill within minutes, making it nearly impossible to distinguish genuine institutional activity from random price movement. Use the 5M only for very precise entry timing on a setup already identified on the 15M or higher.
Use a top-down approach: Daily for bias, 4H/1H for setup identification, 15M for entry refinement. The most reliable IFVG timeframes are 15M, 1H, and 4H. Higher timeframe IFVGs carry more weight — when multiple timeframes align, the probability increases significantly.
- Top-down approach: Daily (bias) → 4H/1H (setup) → 15M (entry)
- Most reliable timeframes: 15M, 1H, 4H
- Higher timeframe IFVG = more institutional weight = stronger level
- Never trade counter to the daily timeframe trend
- Avoid using 5M for IFVG identification — too noisy
Quick Quiz
1. Which timeframe should you use to establish the overall market bias for IFVG trading?
2. Which three timeframes are considered most reliable for IFVG setups?
3. Why does a 4H IFVG carry more weight than a 15M IFVG?
4. Why is the 5-minute chart not recommended for IFVG identification?
Confluence Factors
⏱ 8 min readA lone IFVG has reasonable probability. An IFVG backed by two or three additional confluence factors becomes a high-probability setup. This lesson introduces the most powerful confluence tools to stack on top of your IFVG.
What is Confluence?
Confluence is the coming together of multiple independent reasons for price to react at a specific level. Each additional factor adds weight to your thesis. Think of it like building a legal case — each piece of evidence strengthens the argument for or against a verdict.
The Three Most Powerful Confluence Factors
IFVG + Order Block
An Order Block (OB) is the last opposing candle before a strong impulse move. When an IFVG coincides with an Order Block from the same area, the level has both an imbalance and an institutional order pool. Extremely powerful.
IFVG + Key Level
When an IFVG sits directly at a key structural level — a previous daily high/low, a major support/resistance zone, or a weekly open price — the probability of a reaction is significantly increased.
IFVG + Kill Zone Timing
A Kill Zone is a specific time window of peak institutional activity (London Open, NY Open). An IFVG that price revisits during a Kill Zone is far more likely to produce the expected reaction than one revisited during dead session hours.
The Kill Zones
Kill Zones are essential context for any IFVG trade. Here are the primary windows:
| Kill Zone | Time (GMT) | Best For |
|---|---|---|
| London Open | 07:00–09:00 | Forex majors (GBPUSD, EURUSD, USDJPY) |
| New York Open | 13:00–15:00 | Forex pairs, US indices (NAS100, SP500) |
| London–NY Overlap | 13:00–17:00 | Highest liquidity window for any instrument |
| Asian Session High/Low | 00:00–08:00 | Range-setting for the London sweep — not a trading kill zone itself |
Confluence Scoring
A simple way to grade your IFVG setups is to give each confluence factor a point:
- ✔ IFVG identified on 1H or 4H = 1 point
- ✔ Aligned with higher timeframe trend = 1 point
- ✔ IFVG overlaps with Order Block = 1 point
- ✔ At a key structural level (previous high/low) = 1 point
- ✔ Revisited during a Kill Zone = 1 point
3+ points: High probability — take the trade. 2 points: Medium probability — proceed with caution. 1 point: Low probability — skip unless you have other conviction.
Confluence transforms a good setup into a great one. The three most powerful factors are: IFVG + Order Block, IFVG + Key Level, and IFVG + Kill Zone timing. Score your setups — only take trades with three or more confluence points for the highest probability outcomes.
- Confluence = multiple independent reasons for price to react at a level
- Top 3 factors: IFVG + Order Block, IFVG + Key Level, IFVG + Kill Zone
- Kill Zones: London Open (07:00–09:00 GMT), NY Open (13:00–15:00 GMT)
- Score your setups: 3+ points = high probability; 1 point = low probability, skip
Quick Quiz
1. What does confluence mean in trading?
2. What is an Order Block in relation to an IFVG?
3. The London Open Kill Zone runs approximately from...
4. Using the confluence scoring system, how many points should a setup have before you consider it high probability?
Common Mistakes
⏱ 8 min readUnderstanding what to do is only half the battle. Knowing what not to do — and why traders repeatedly fall into the same traps — is what separates profitable IFVG traders from those who struggle.
Mistake 1: Trading Every FVG as If It Will Invert
This is the most common error. Not every FVG becomes an IFVG. Many FVGs are filled and simply disappear — the market moves on and the zone is never respected again. You must wait for the confirmation of inversion: the structural shift after the fill, and the measured return to the zone.
Chasing every filled FVG with a trade is the equivalent of betting at every potential level on a chart. The edge comes from being selective, not from volume of trades.
A beginner takes 20 trades a week looking for FVG/IFVG setups. A professional takes 3–5 high-conviction setups a week and sizes them appropriately. The professional's edge comes from patience and selectivity, not from activity.
Mistake 2: Entering Before Confirmation
Anticipating the IFVG reaction before it happens is a form of overconfidence. You may see price approaching the IFVG zone and jump in early — only to watch price sweep straight through the level and stop you out before reversing, if it reverses at all.
The confirmation candle (rejection wick, engulfing, or lower timeframe BOS) is not optional. It is the gate you must pass through before entering. Without it, you are guessing.
Mistake 3: Ignoring Higher Timeframe Bias
This error causes traders to take technically valid IFVG setups in the wrong direction. A bearish IFVG that forms beautifully on the 1H but sits in the middle of a strong daily uptrend is a low-probability short. The higher timeframe trend acts like a tide — you can swim against it briefly, but it will push you back.
Always establish the daily bias first. If you want to take a bearish IFVG, the daily chart must show a bearish trend or at least a distribution structure. Never trade an IFVG blind to the bigger picture.
Mistake 4: Using the Asian Session for IFVG Identification
FVGs and IFVGs formed during the low-liquidity Asian session lack institutional backing. They are often created by thin market conditions rather than genuine order flow. These zones are frequently swept through without respect during the subsequent London session.
Mistake 5: Poor Risk Management
Even the best IFVG setup can lose. If you risk 5–10% per trade and take three consecutive losses (a perfectly normal run), you are in severe drawdown. Proper IFVG trading requires consistent risk sizing — typically 0.5%–2% of account per trade.
| Mistake | Why It Happens | The Fix |
|---|---|---|
| Trading every filled FVG | Impatience, desire for action | Only trade after structural confirmation of inversion |
| Entering before confirmation | Fear of missing the move | Wait for the confirmation candle — always |
| Ignoring higher TF bias | Tunnel vision on the setup TF | Always check the daily chart first |
| Asian session FVGs | Not understanding session context | Only use FVGs from London/NY sessions |
| Poor risk management | Overconfidence, greed | Never risk more than 1–2% per trade |
Keep a detailed trading journal that records every IFVG you identify — whether you traded it or not, and why. Over time, reviewing your journal will reveal your personal patterns of error and help you refine the strategy to your specific strengths and weaknesses. No journal = no learning loop.
The five critical IFVG mistakes are: trading every filled FVG, entering before confirmation, ignoring higher timeframe bias, using Asian session gaps, and poor risk management. Fixing these five issues alone will dramatically improve your results. Trade fewer setups, wait for confirmation, check the daily, use London/NY FVGs, and keep risk consistent at 1–2% per trade.
- Not all filled FVGs become IFVGs — wait for structural confirmation
- Never enter without a confirmation signal at the IFVG zone
- Always establish daily bias before trading any IFVG
- Discard FVGs formed during the Asian session
- Risk 0.5%–2% per trade maximum — protect the account above all else
- Journal every IFVG identification to build a learning loop
Quick Quiz
1. What makes an IFVG setup invalid before entry?
2. Why is the higher timeframe bias non-negotiable before taking an IFVG trade?
3. What is the recommended maximum risk per trade for IFVG trading?
4. What is the purpose of keeping a trading journal for IFVG setups?
IFVG Strategy — Complete!
You've completed the full Inverse Fair Value Gap strategy course. You now understand how FVGs form, when they invert, how to enter with precision, and how to manage trades like a professional. Now apply this to your charts.